This guide will show you how to use sales-i’s Campaigns features to find which customers’ spend shrunk by 10% or more over the last 3 months. Please note: Campaigns can only be created by power users. However, anyone with access can run the results.
Desktop
Download a PDF version
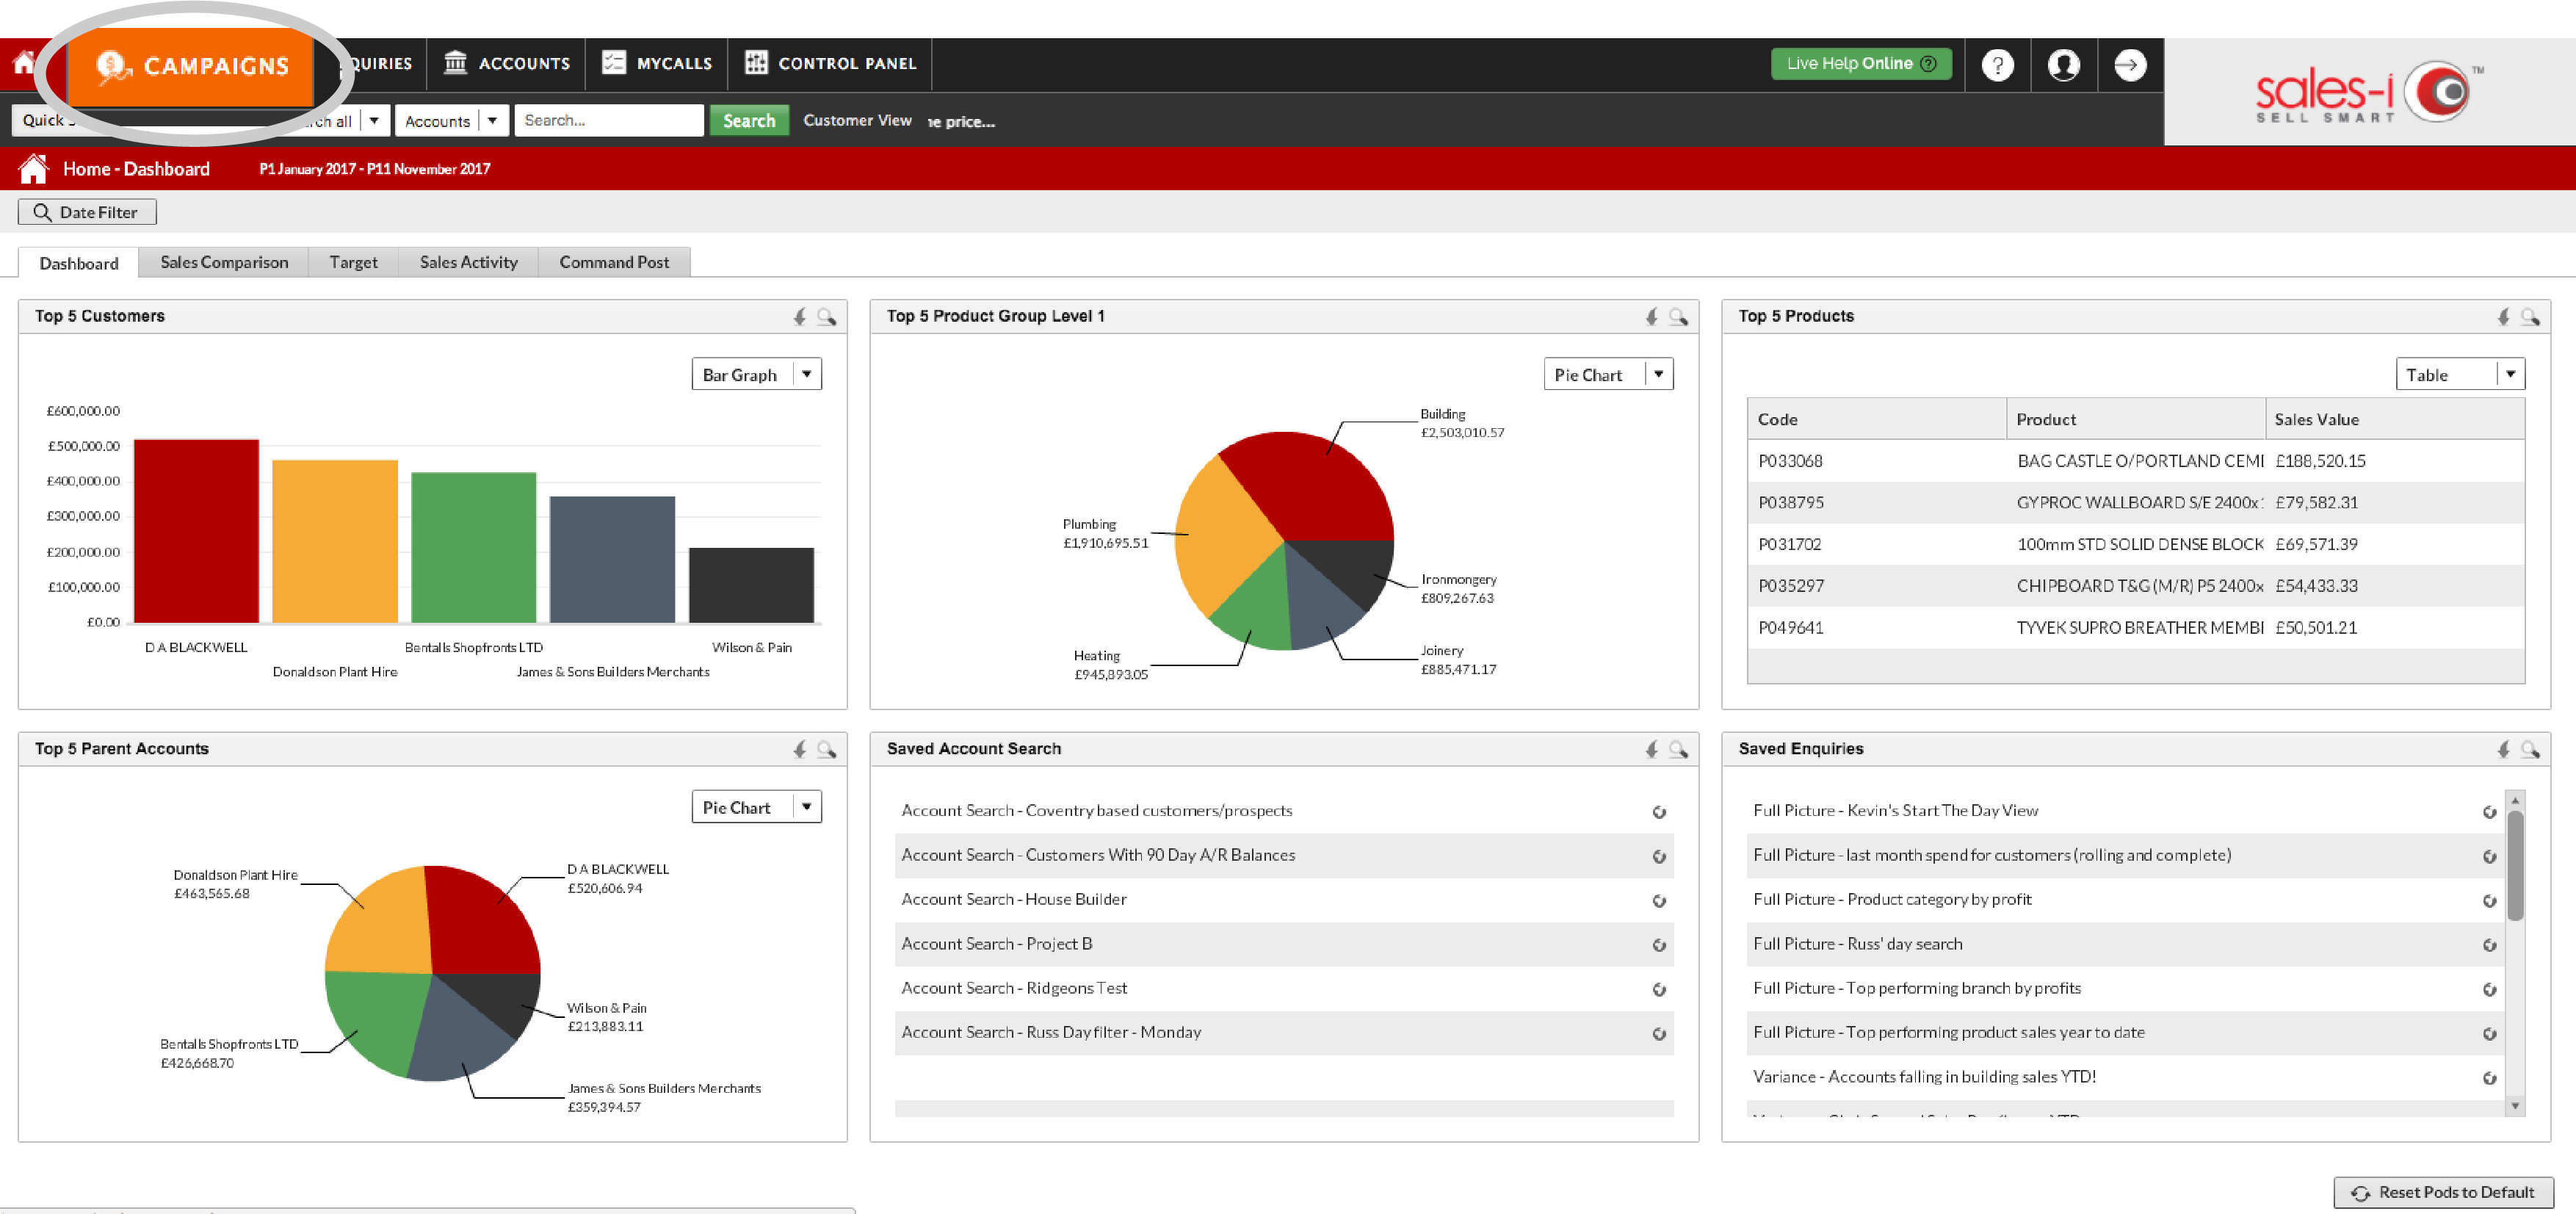
Step 1: Go to Campaigns
From the black navigation bar at the top of the screen, click Campaigns.
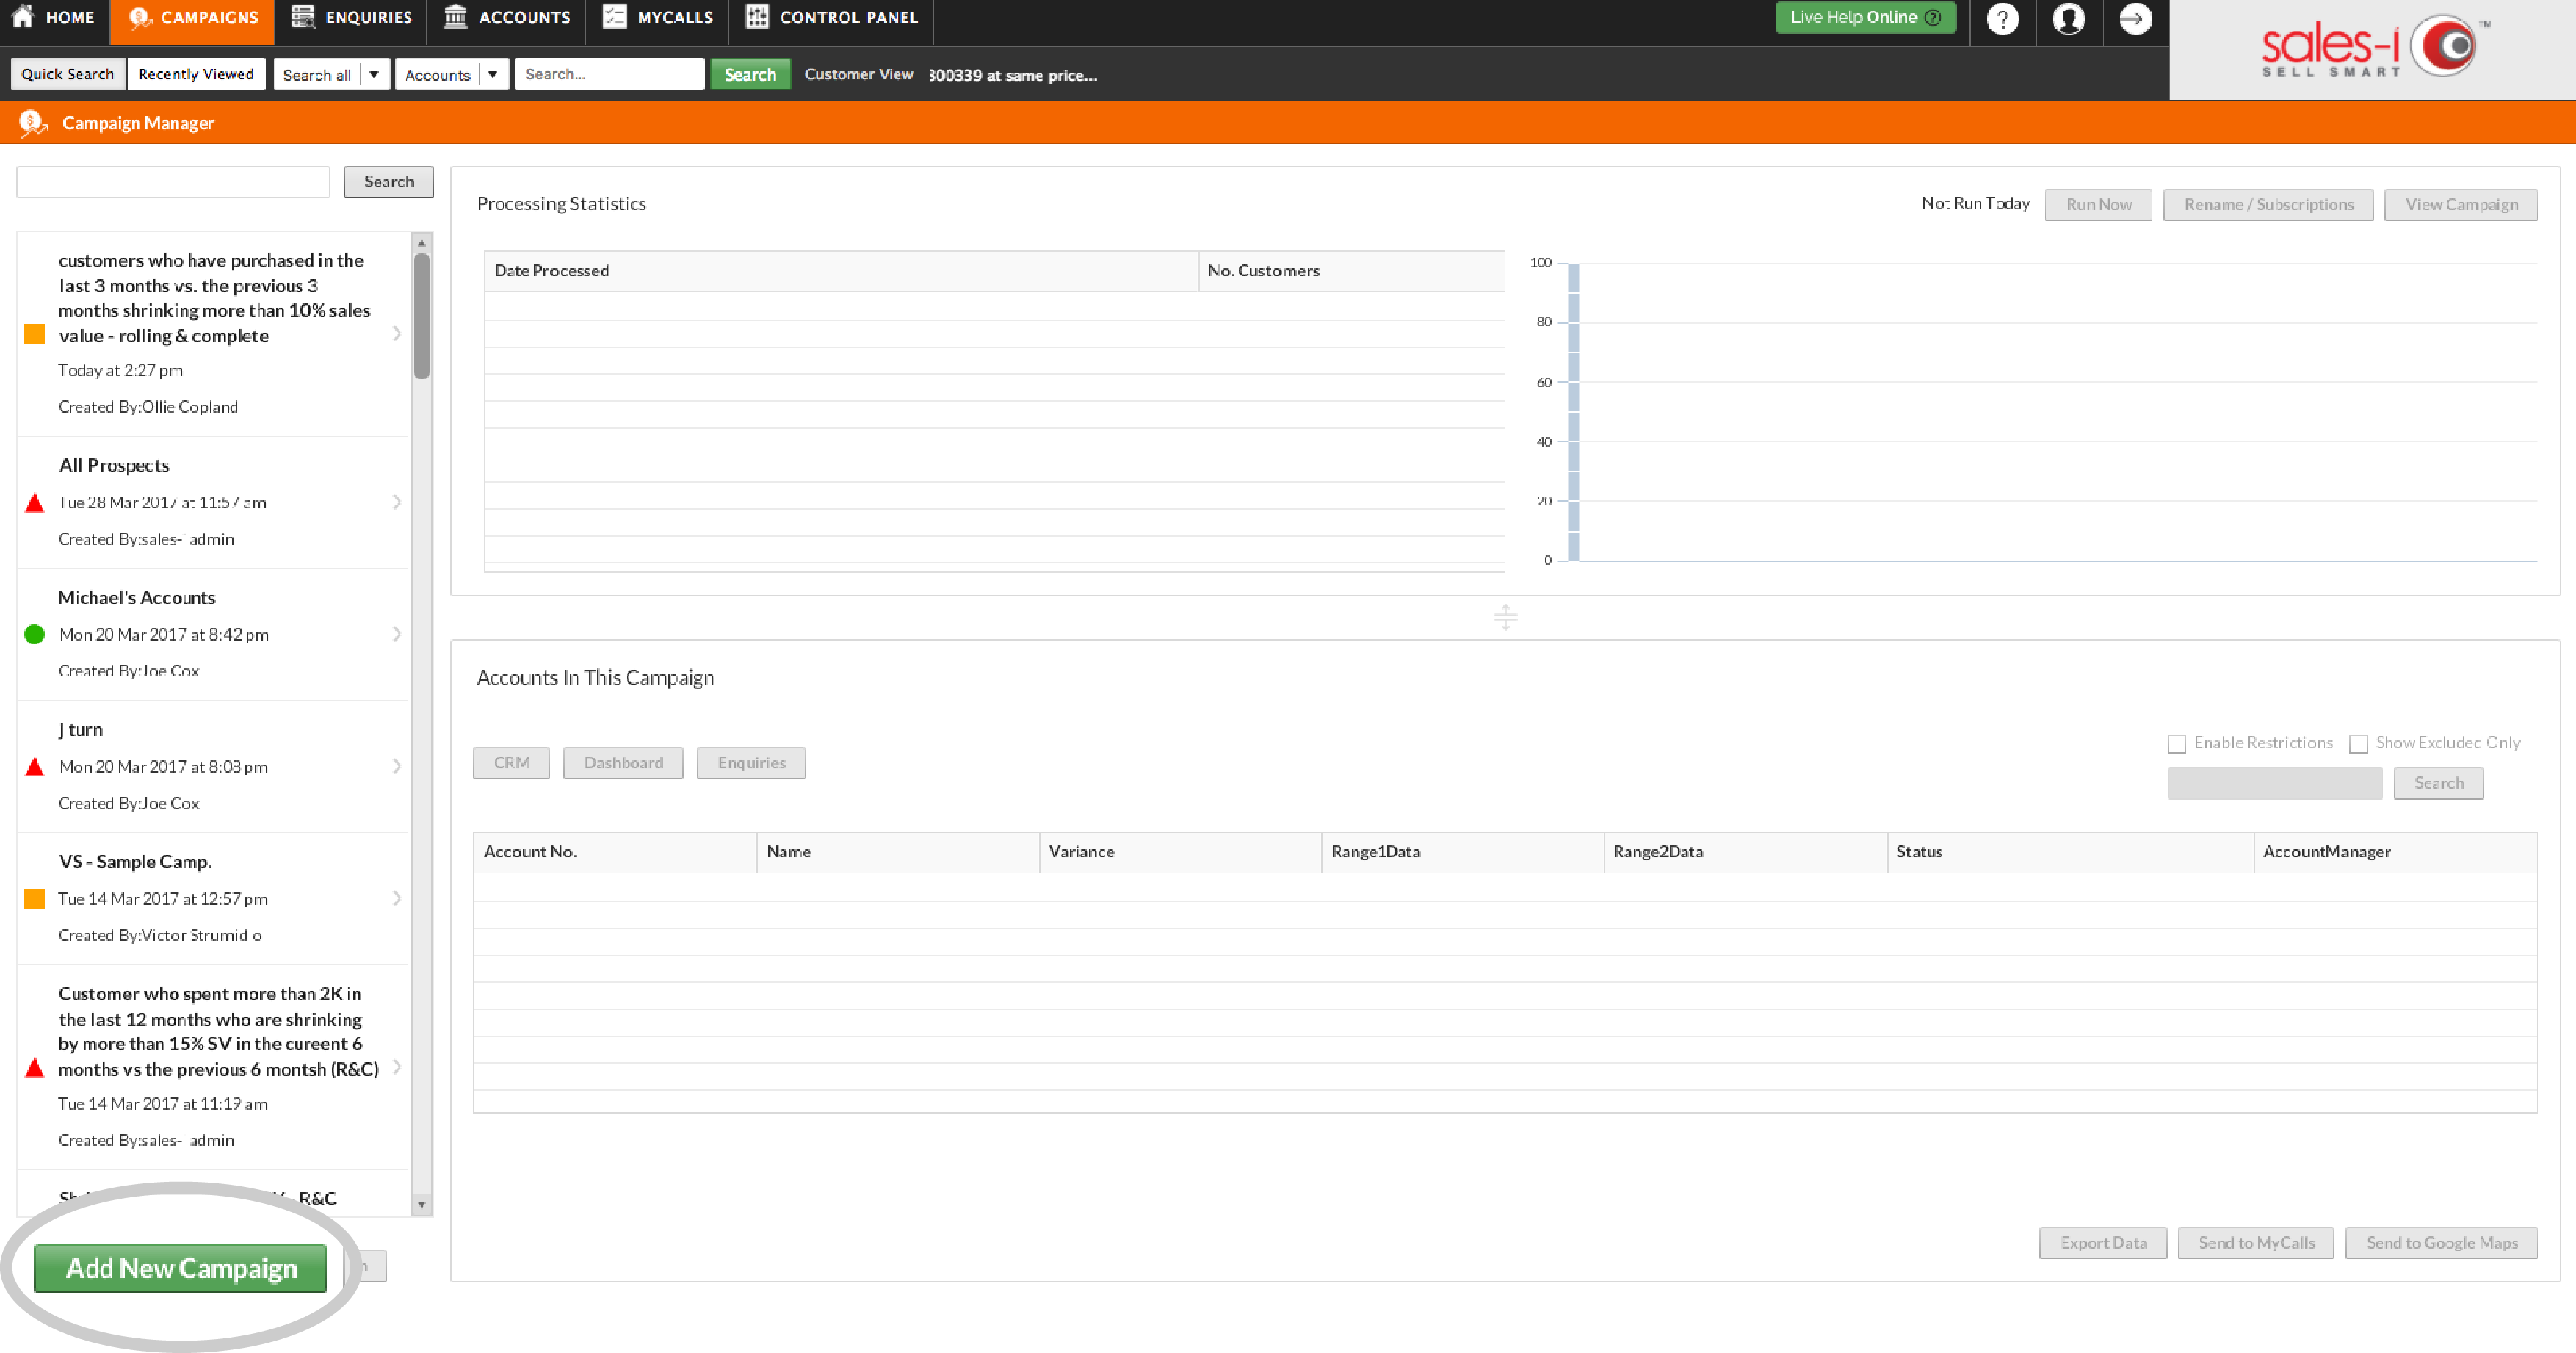
Step 2: Add a New Campaign
Click the green Add New Campaign button at the bottom left of the screen.
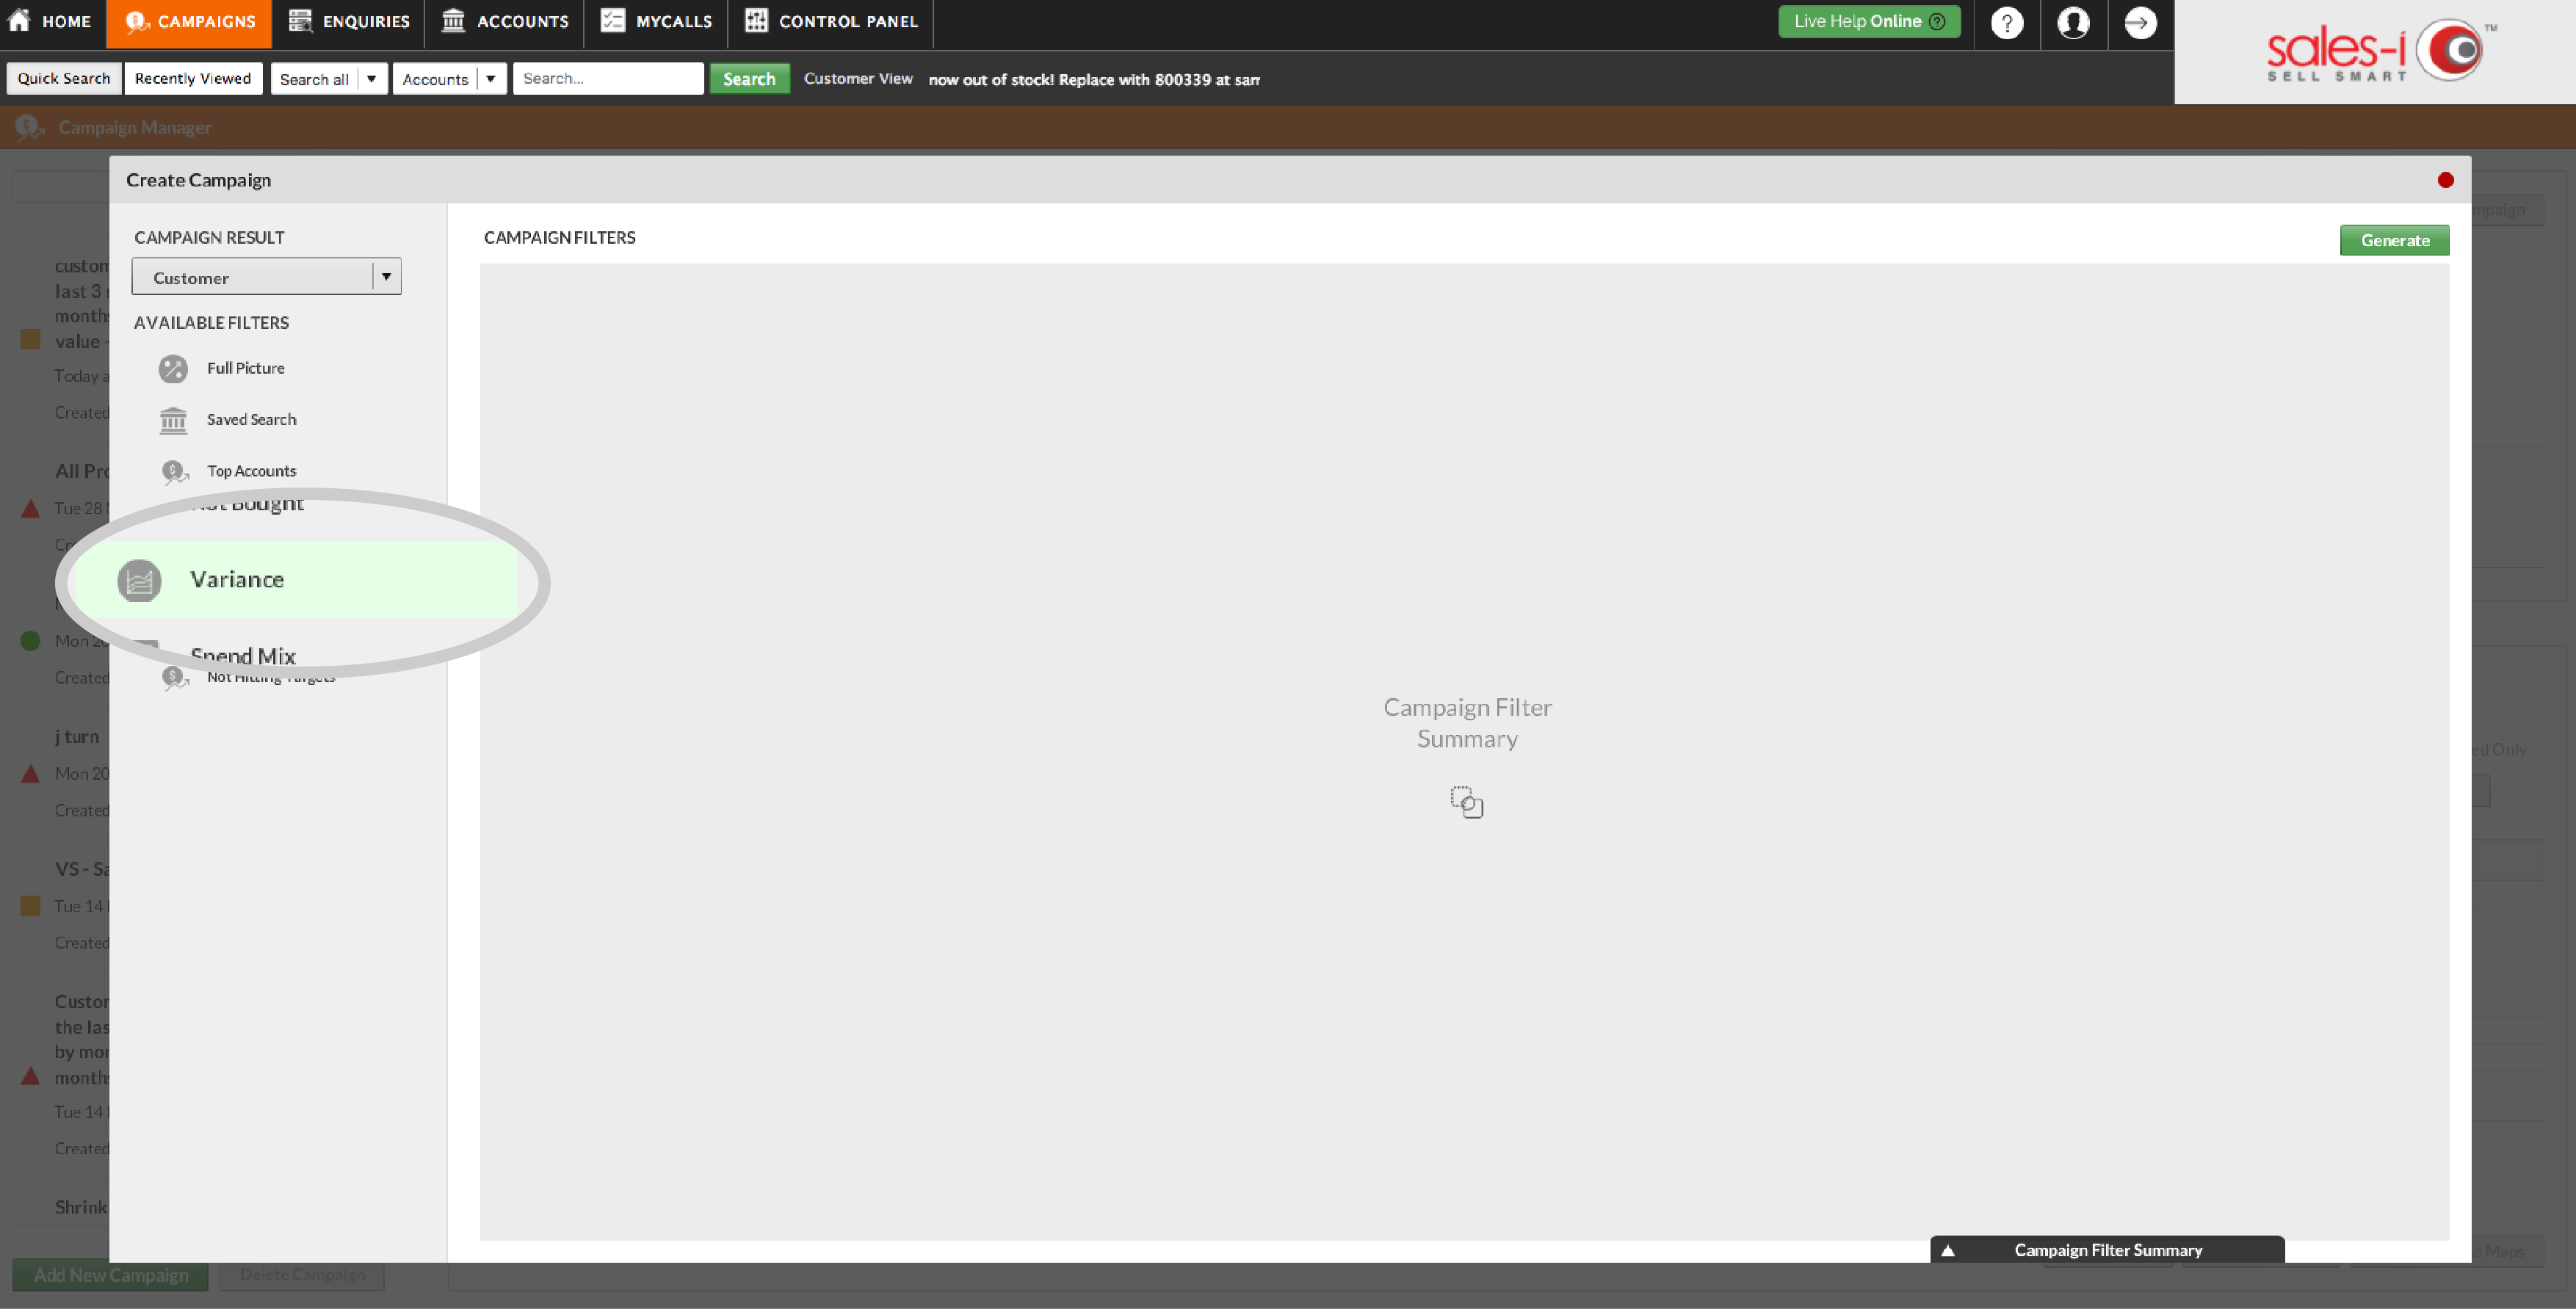
Step 3: Add Variance Filter
Select the Variance filter and drag and drop into the large box on the right.
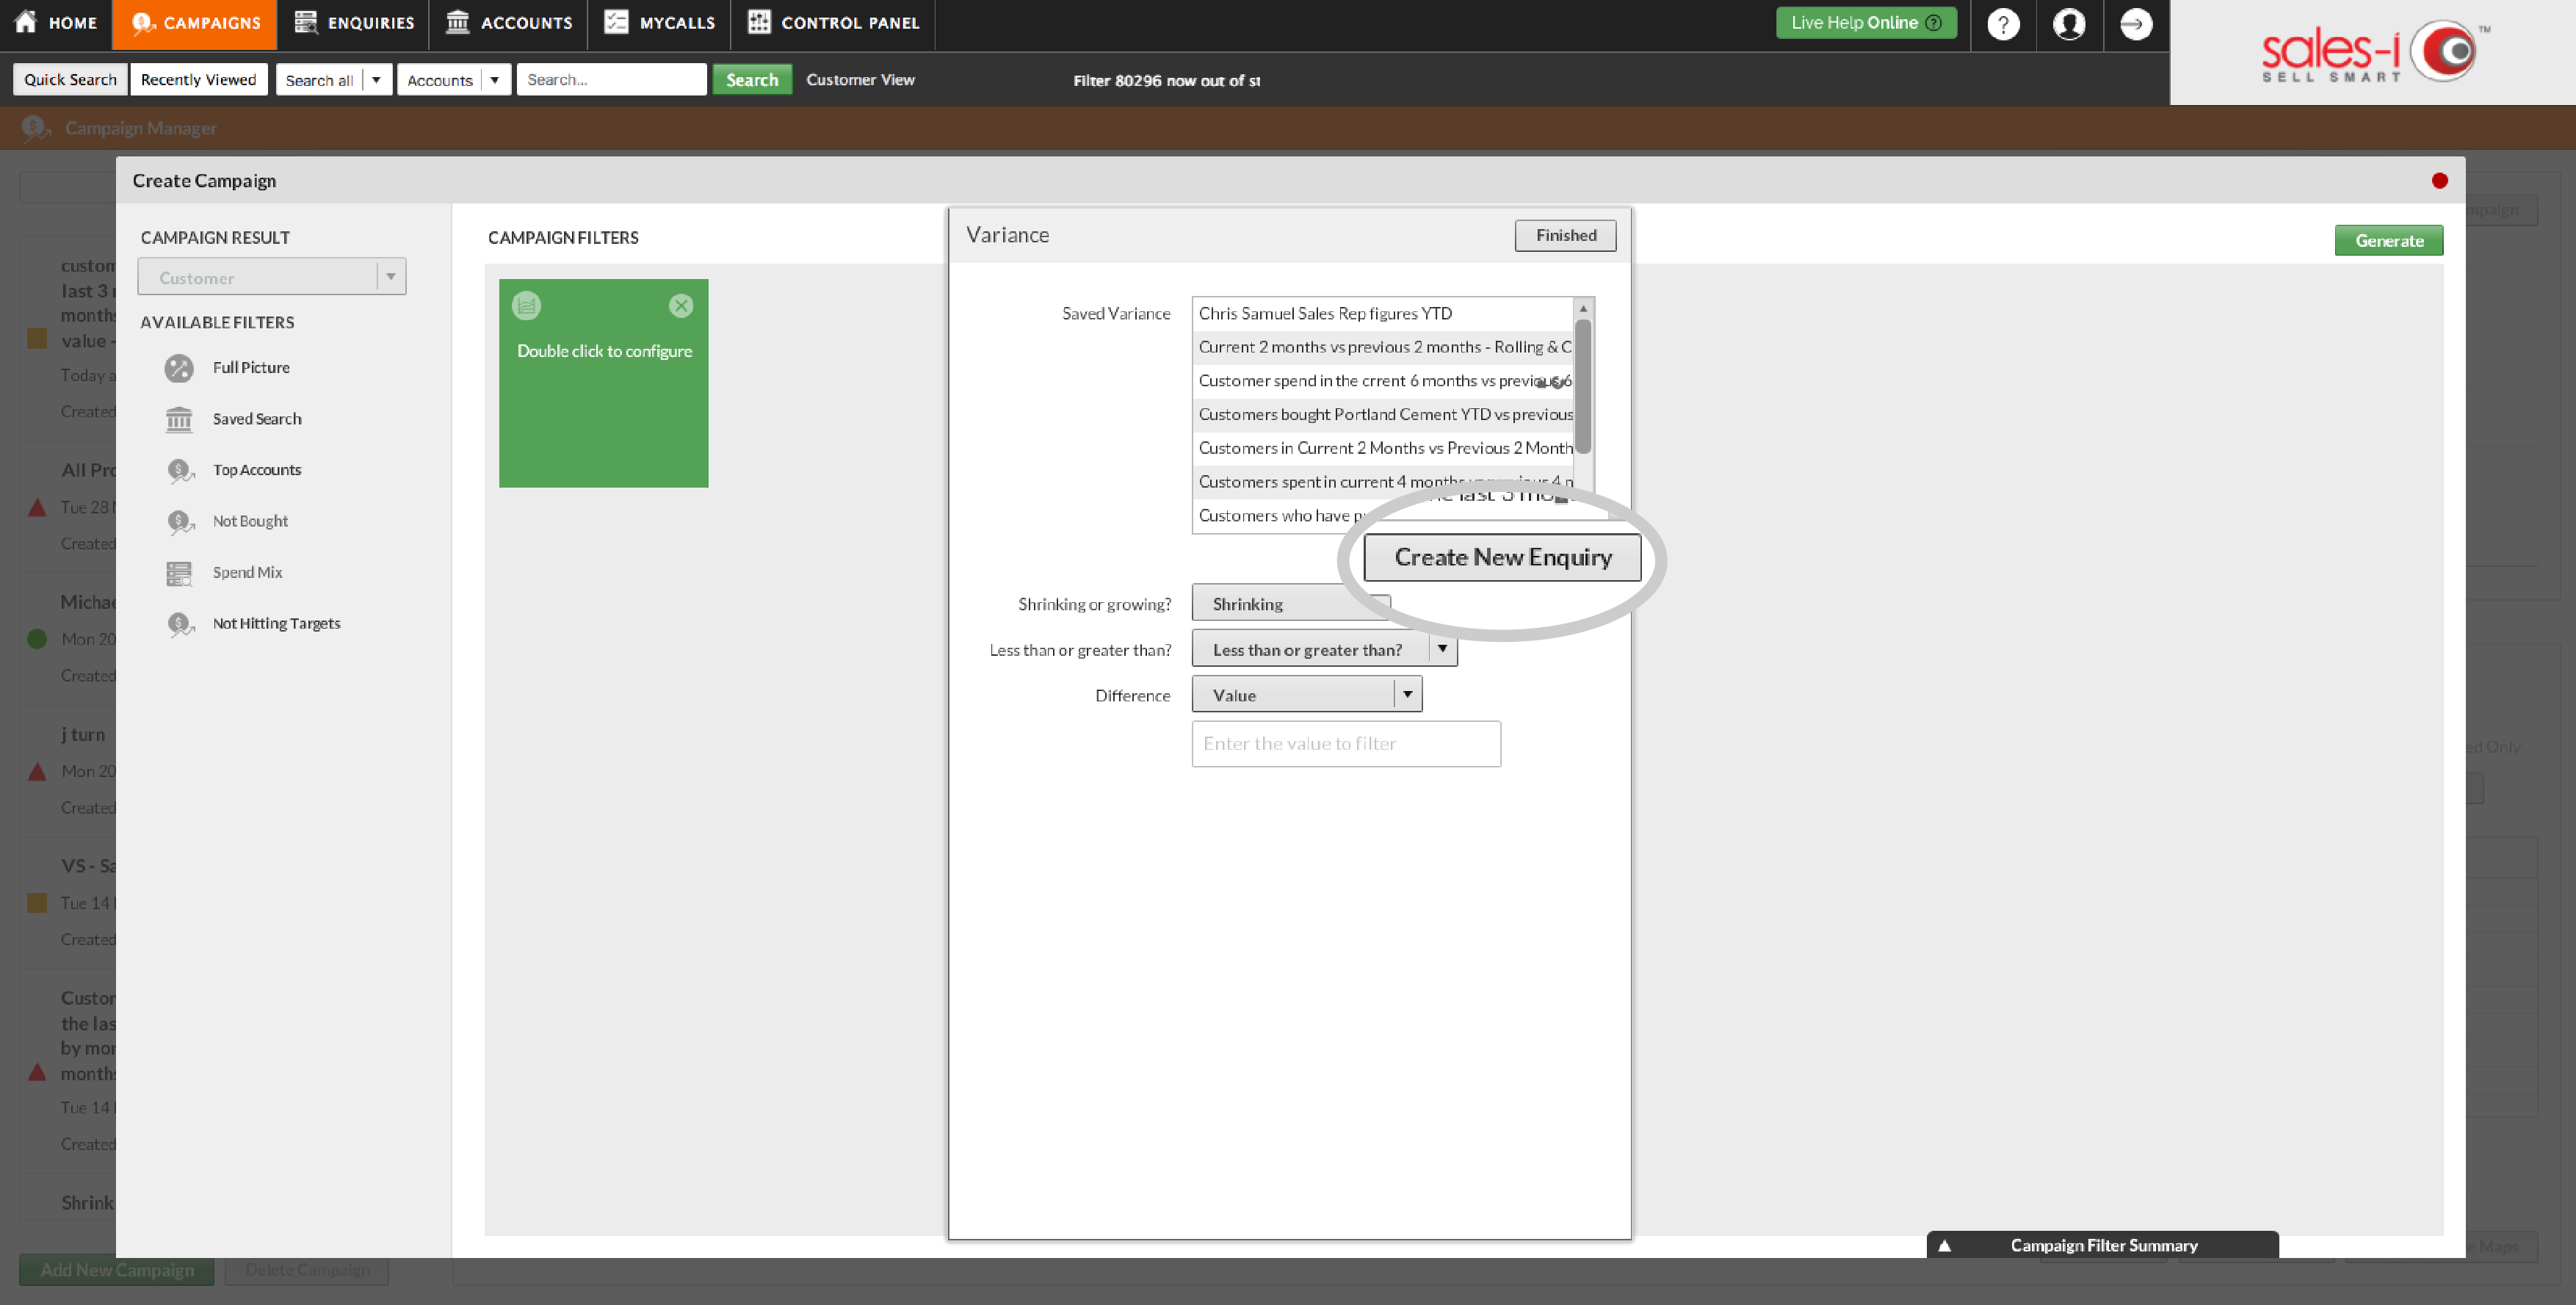
Step 4: Create a New Enquiry
In the new window that appears click Create New Enquiry.
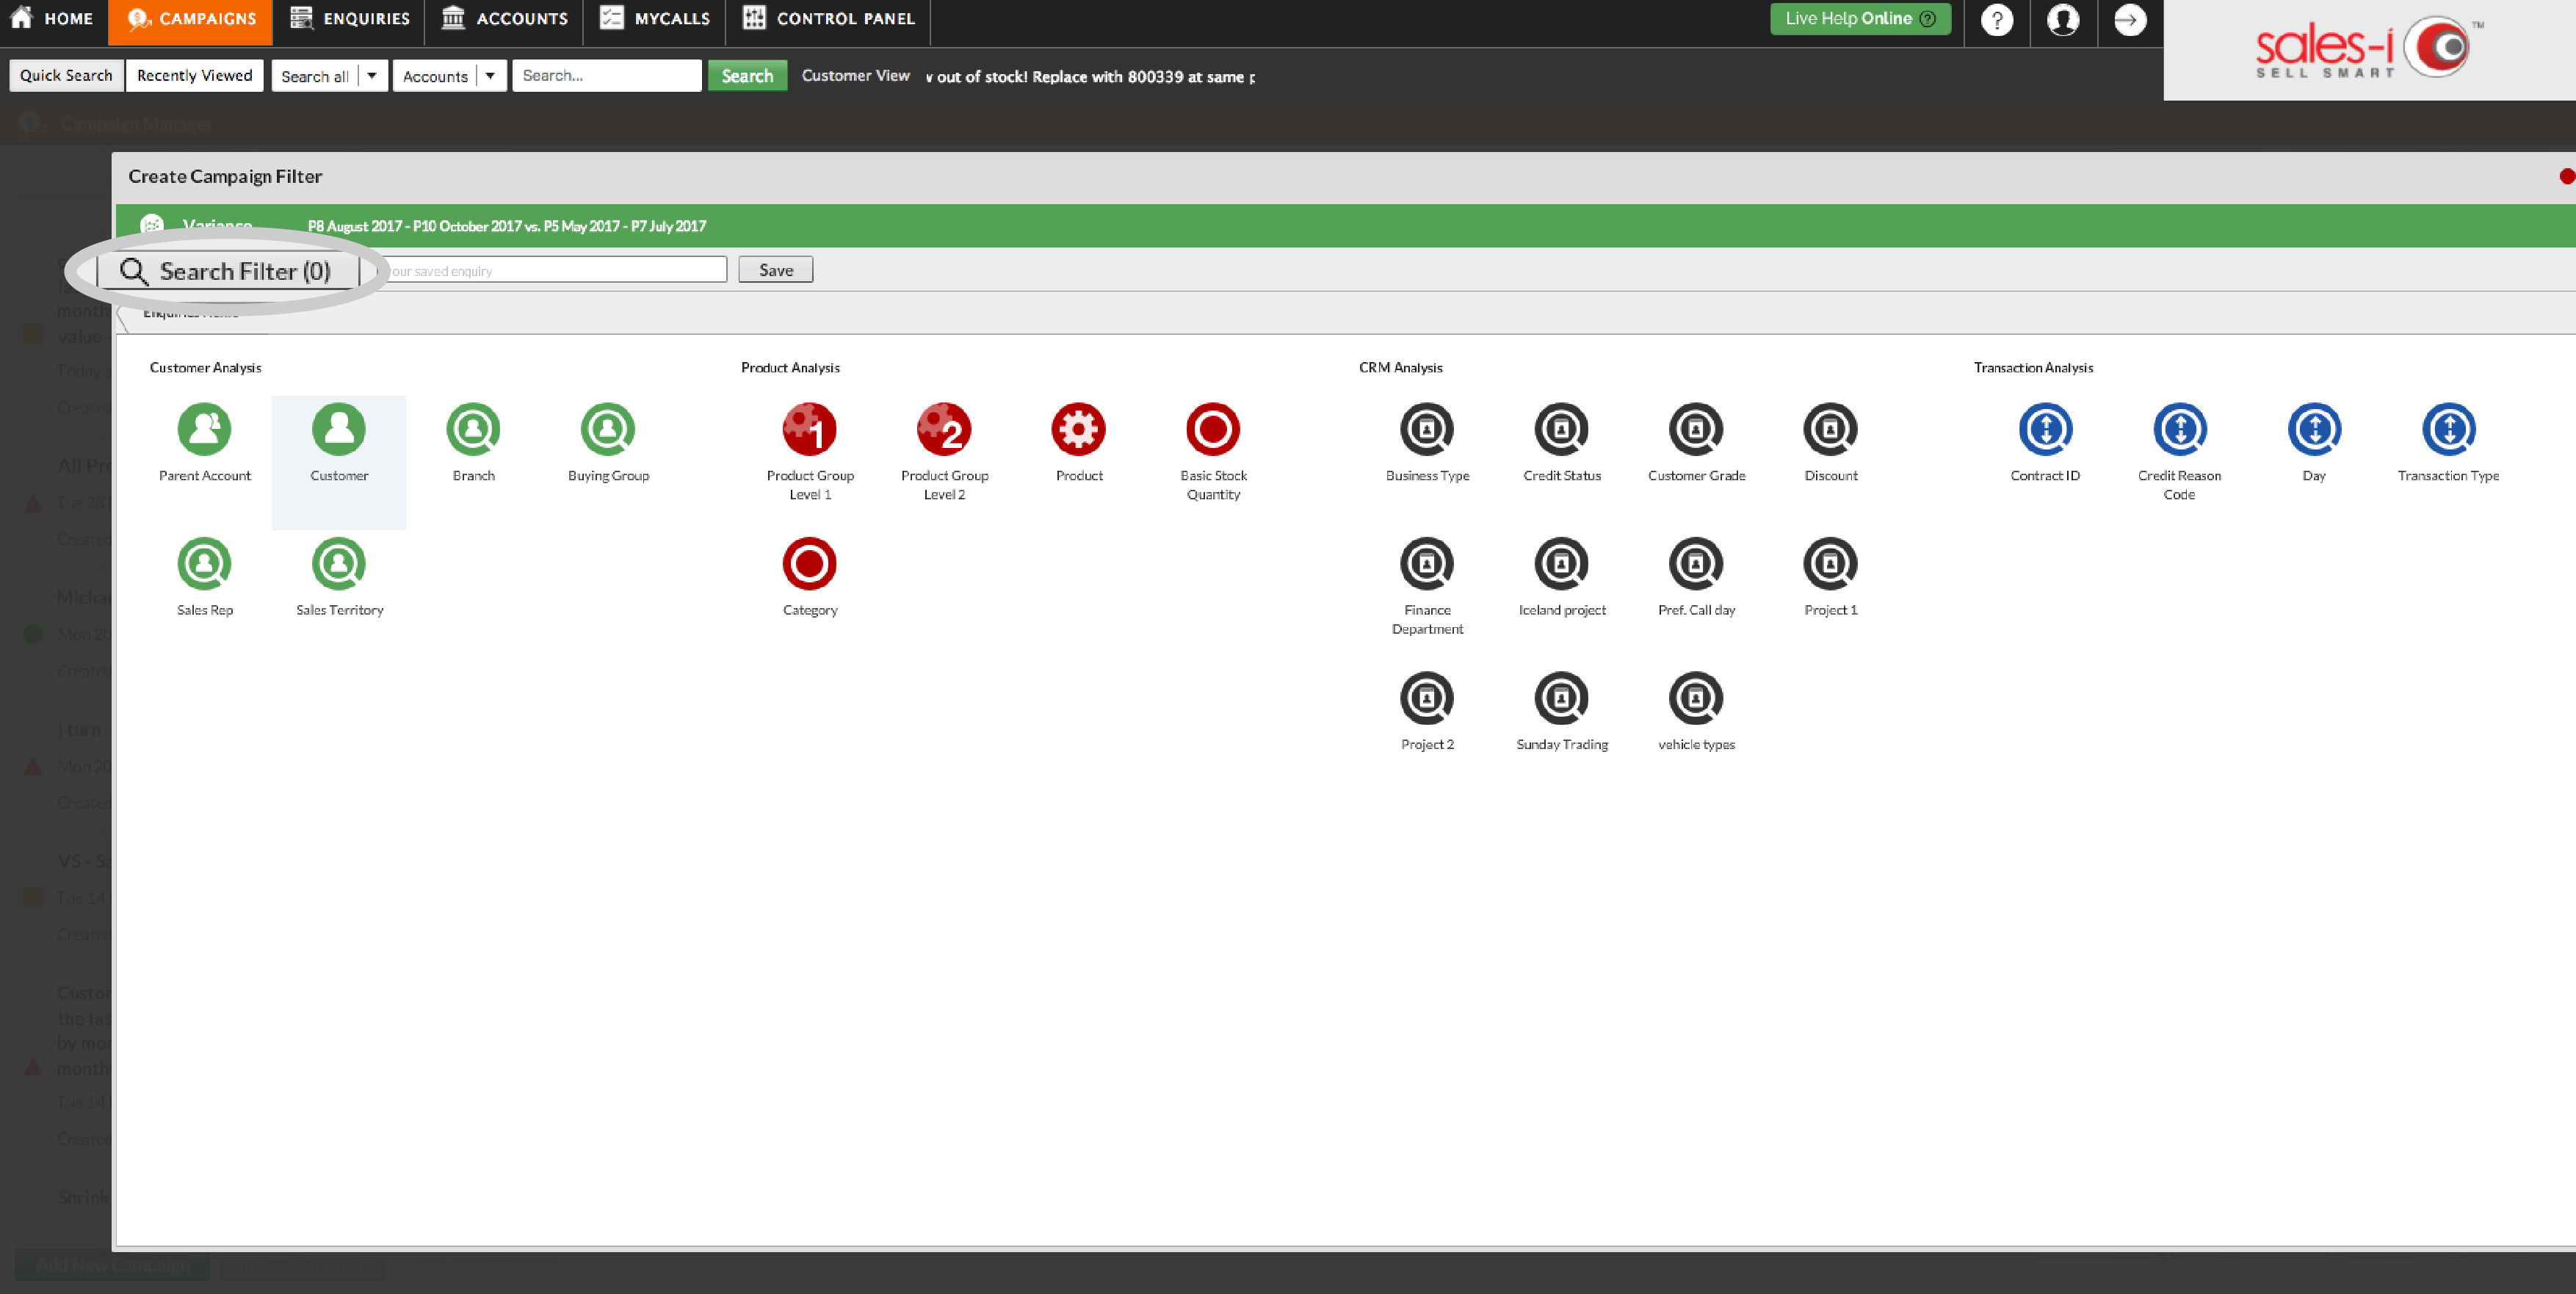
Step 5: Adjust Filters
Click Search Filter in the top left of the window, this will allow you to adjust many filters.
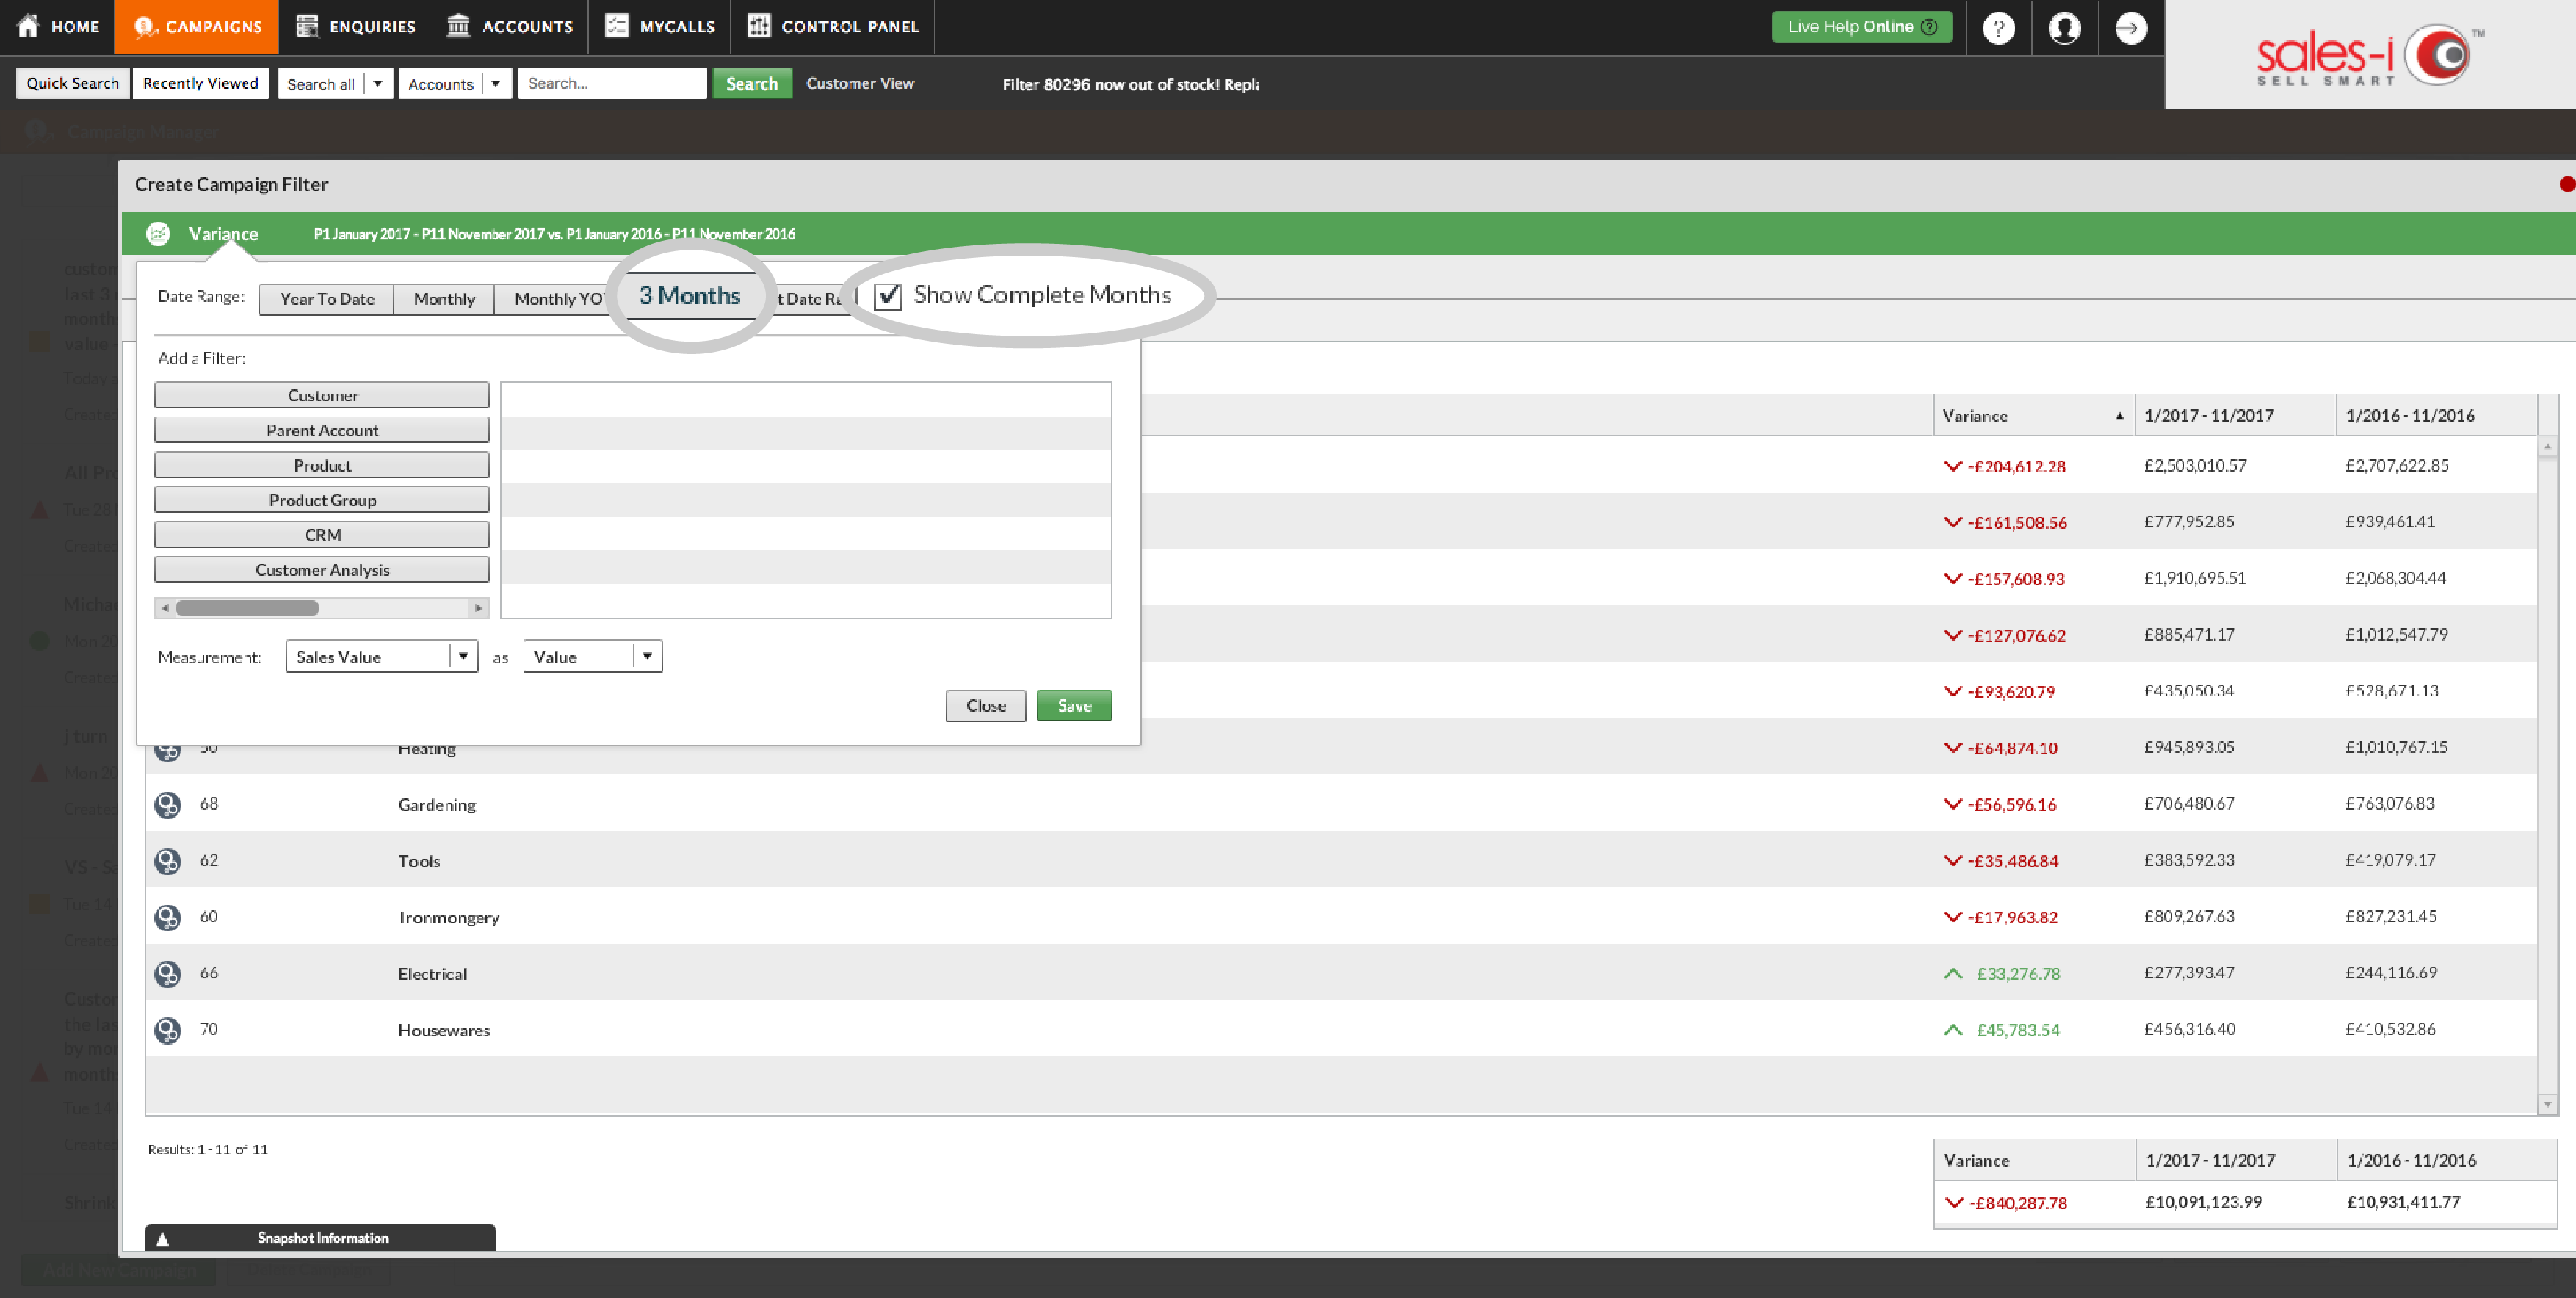
Step 6: Build a Search
Select the 3 months date button, then tick Show Complete Months* and then click the green save button in the bottom right hand corner.
*When ticked the Show Complete Months option excludes the current calendar month.
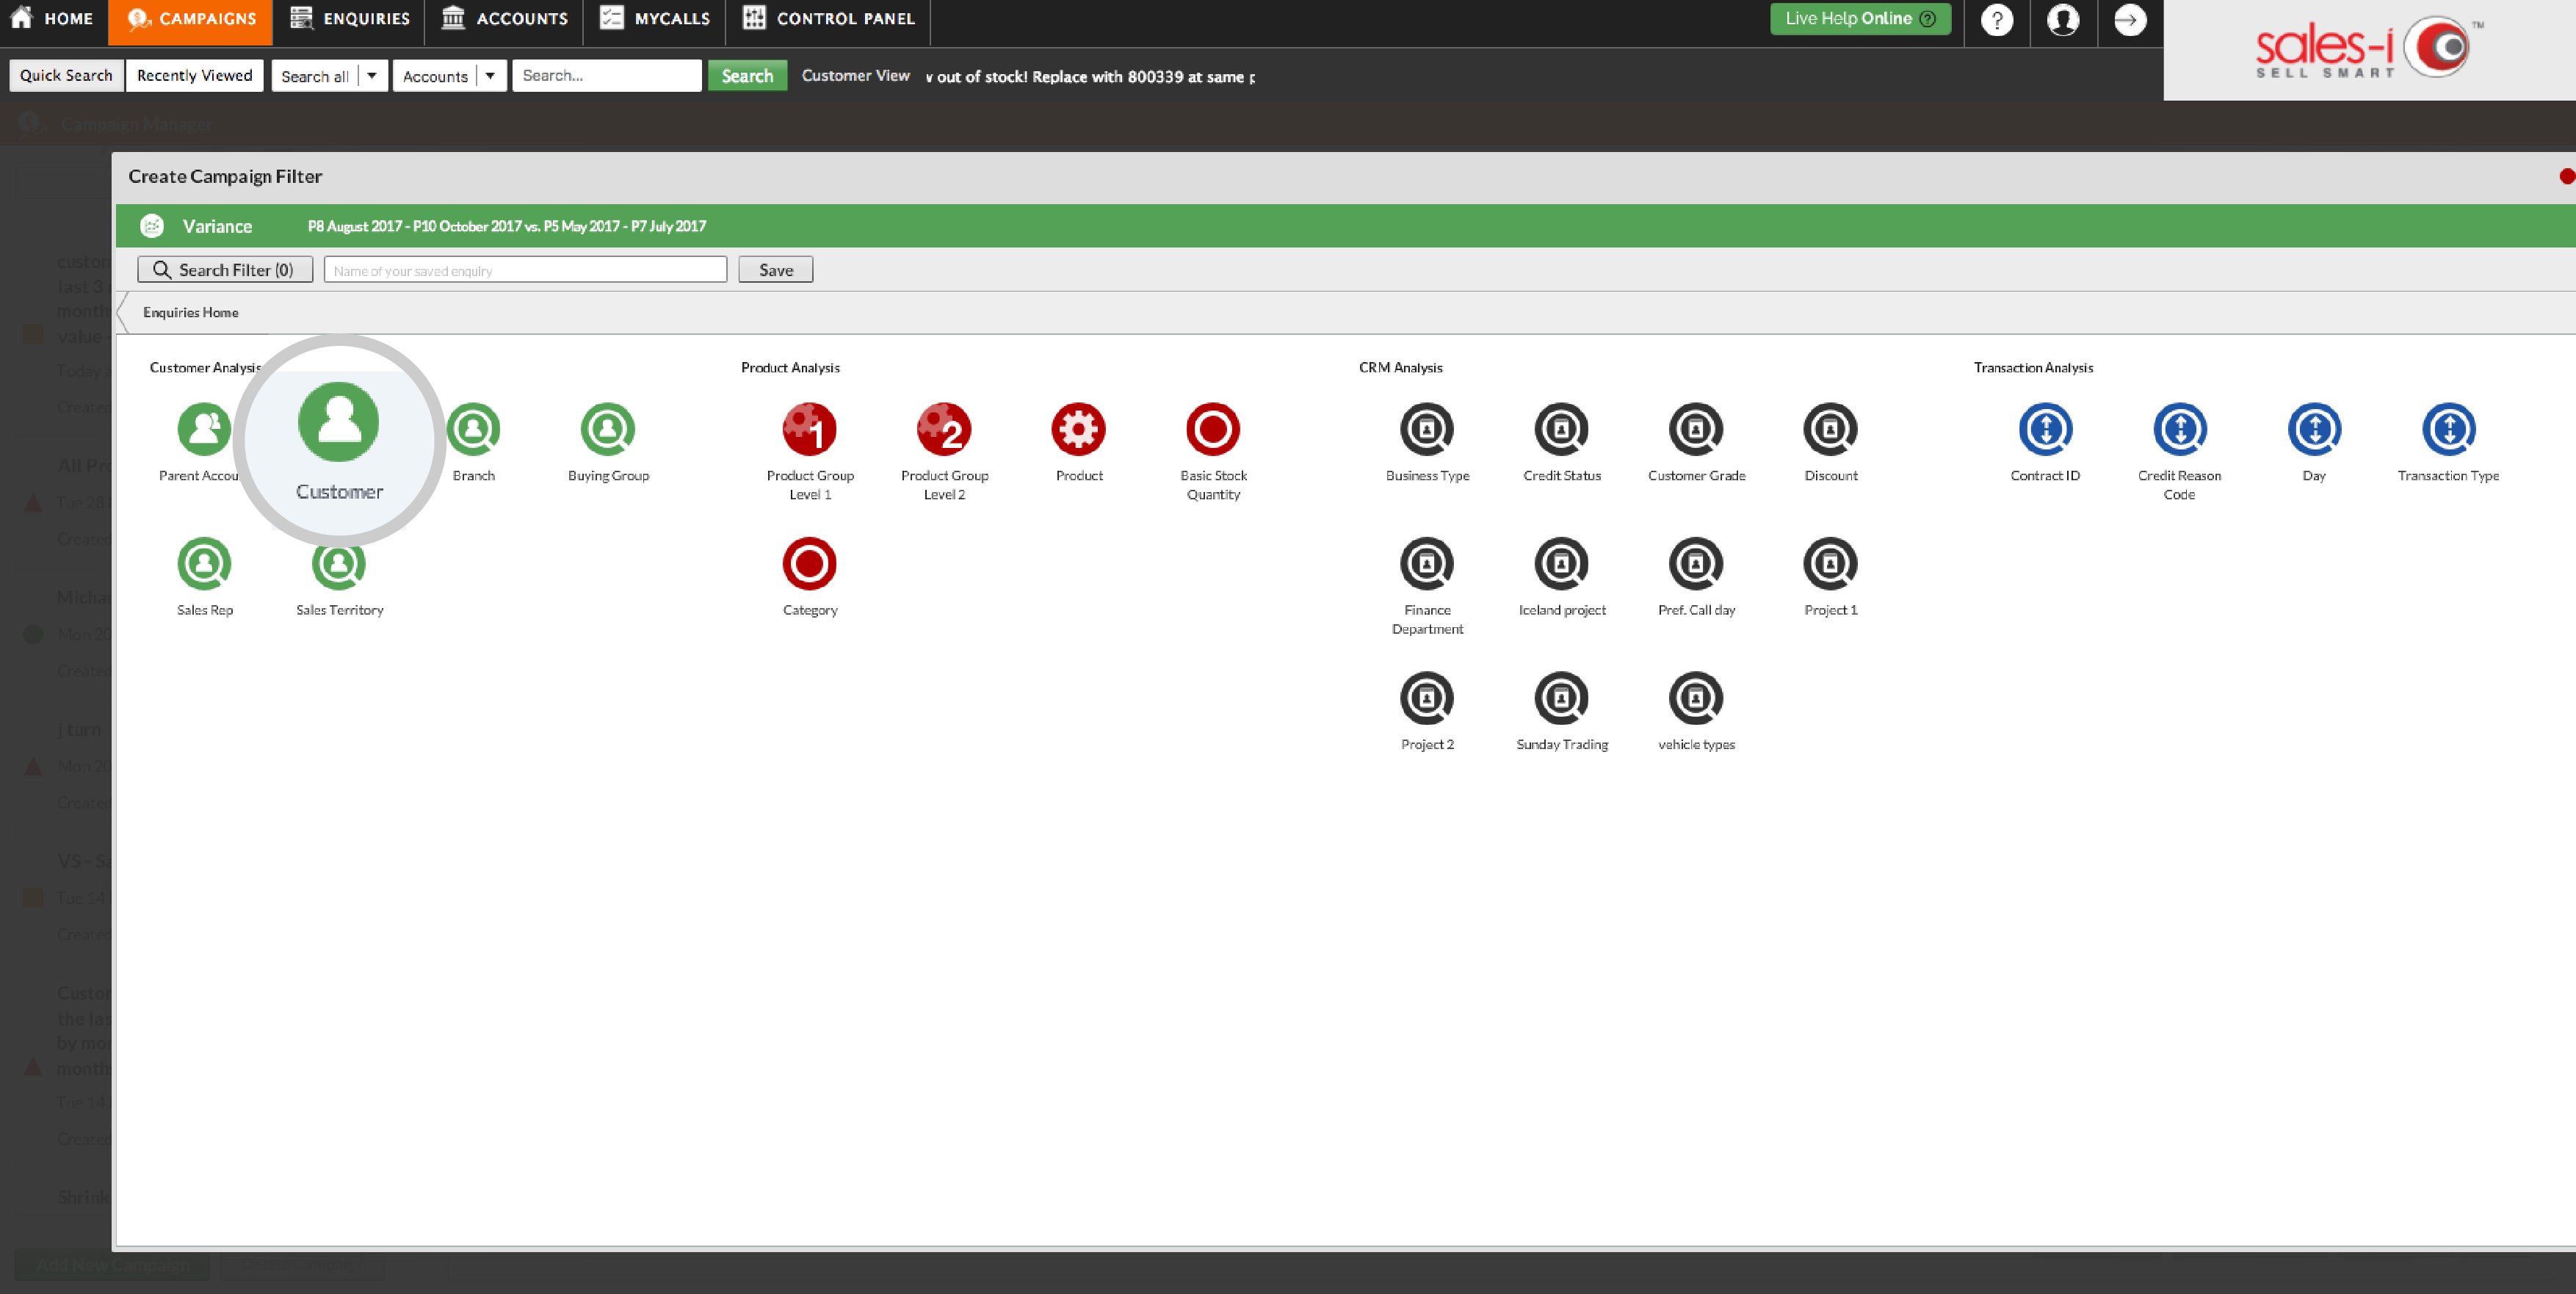
Step 7: Select Customer Icon
Select the Customer bubble, which can be found in the Customer Analysis section.
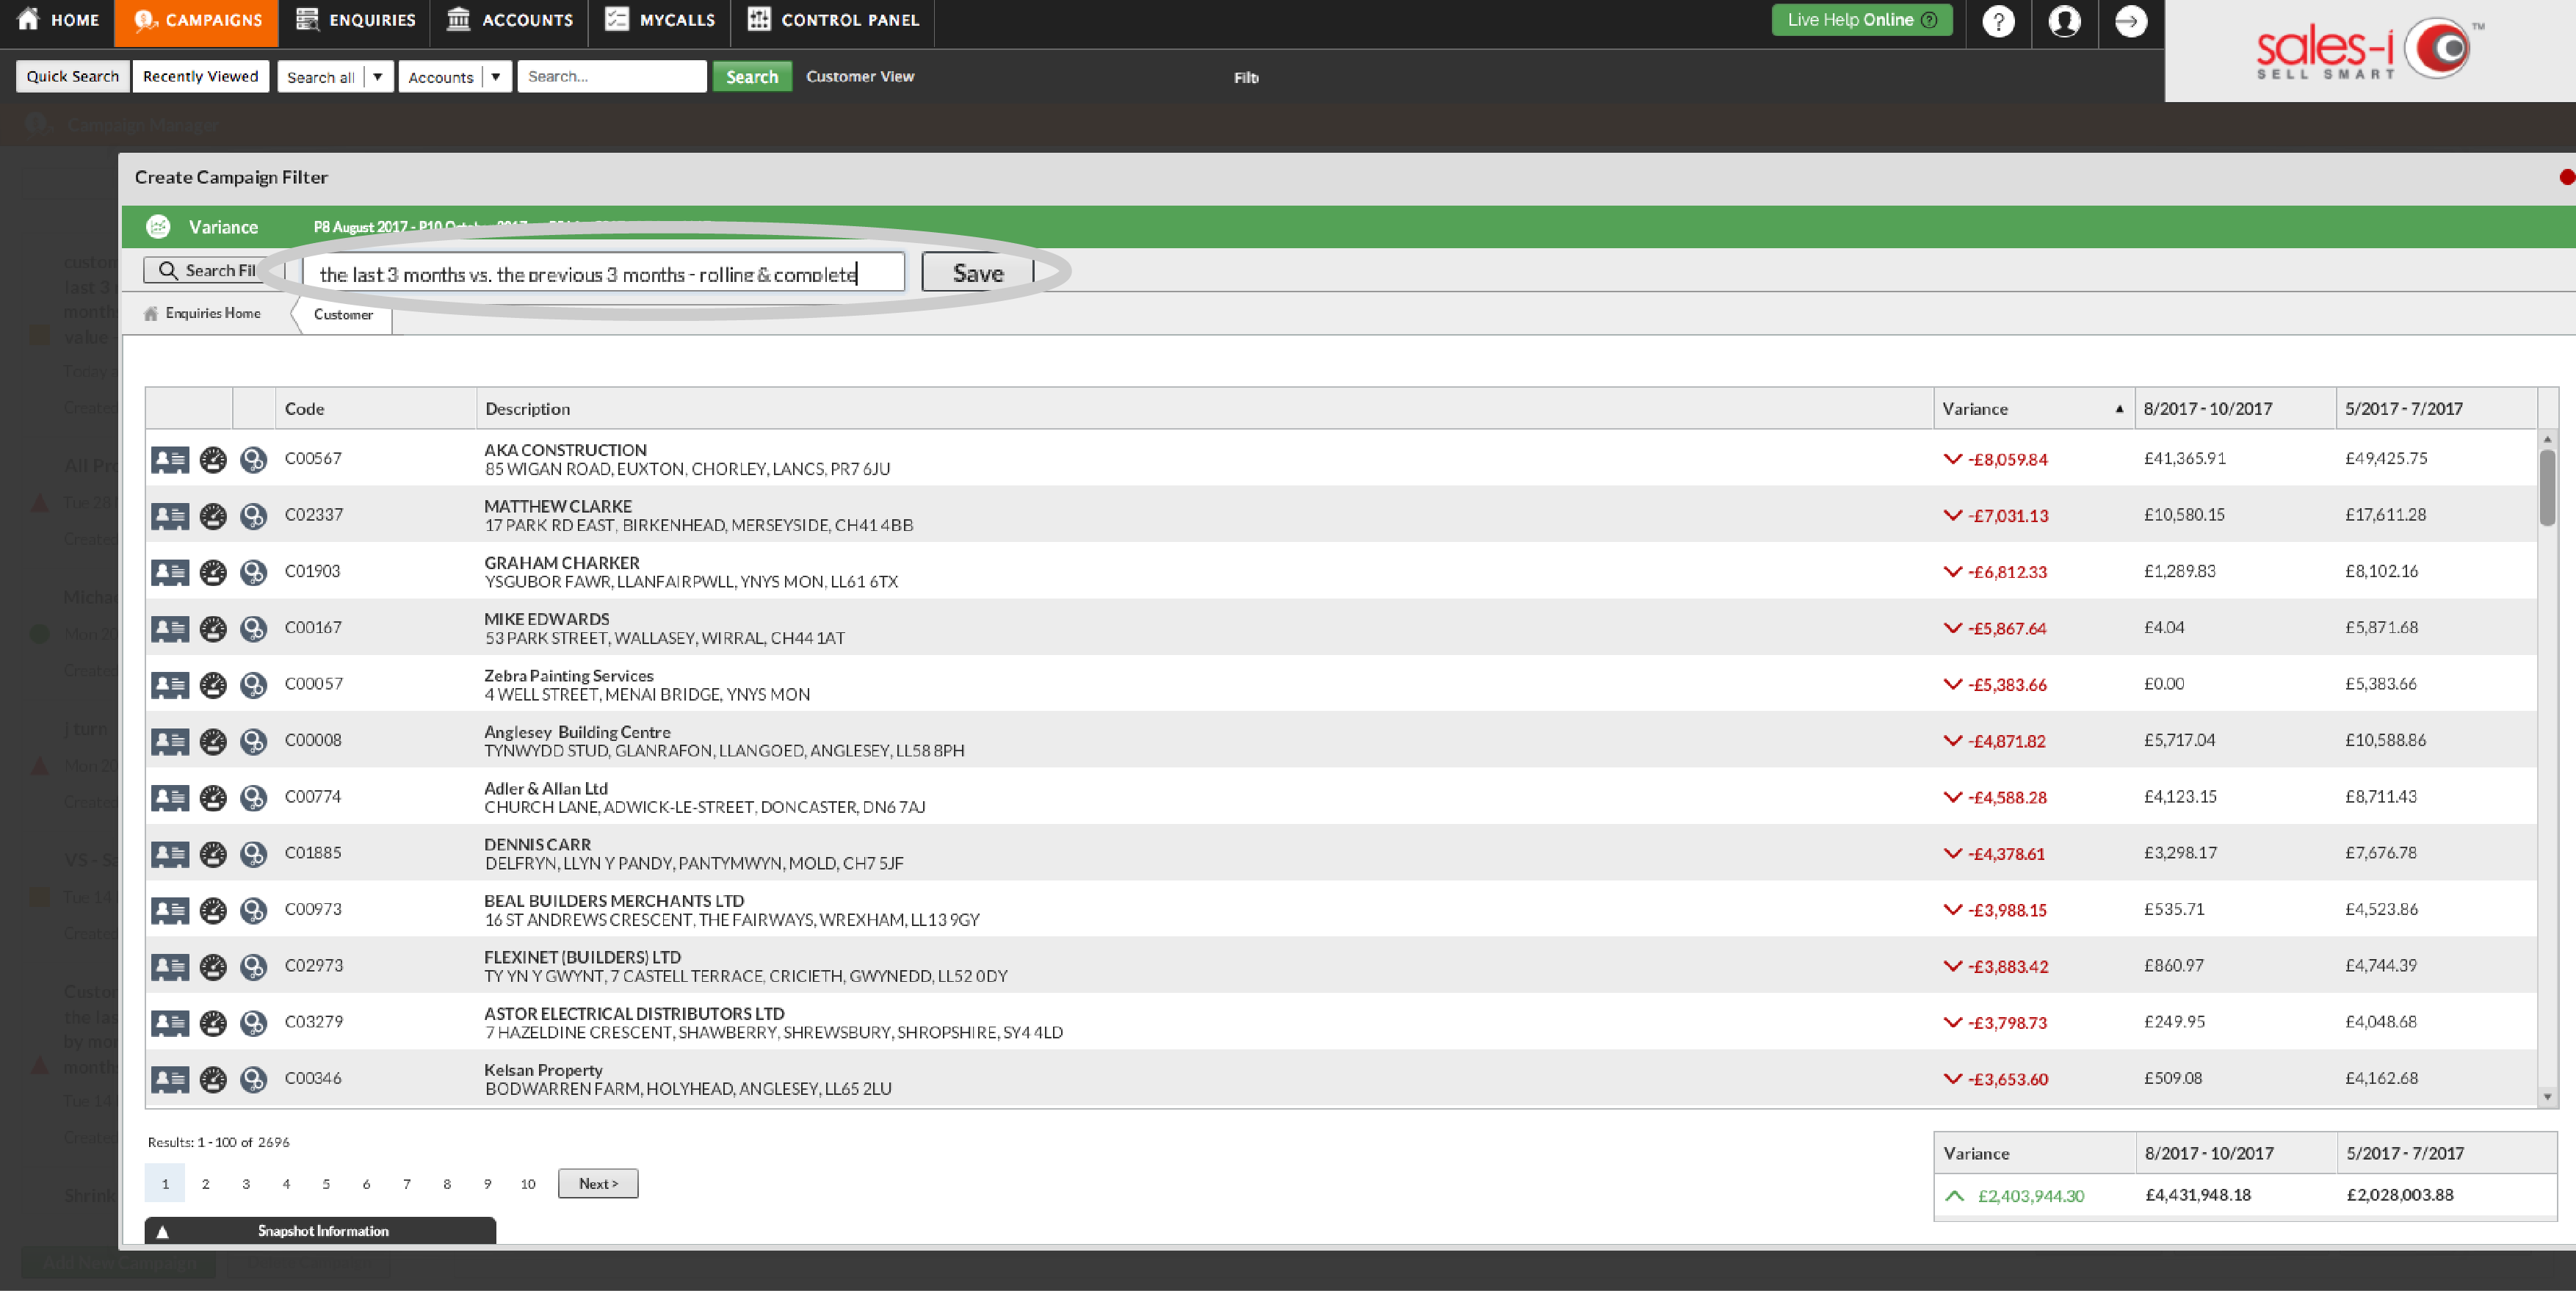
Step 8: Name Enquiry
Now name your enquiry. For this example we’ll use ‘customers who have purchased in the last 3 months vs. the previous 3 months – rolling & complete’. Click Save.
*Please note: At this point you’re saving this enquiry using all data from the time frame selected.
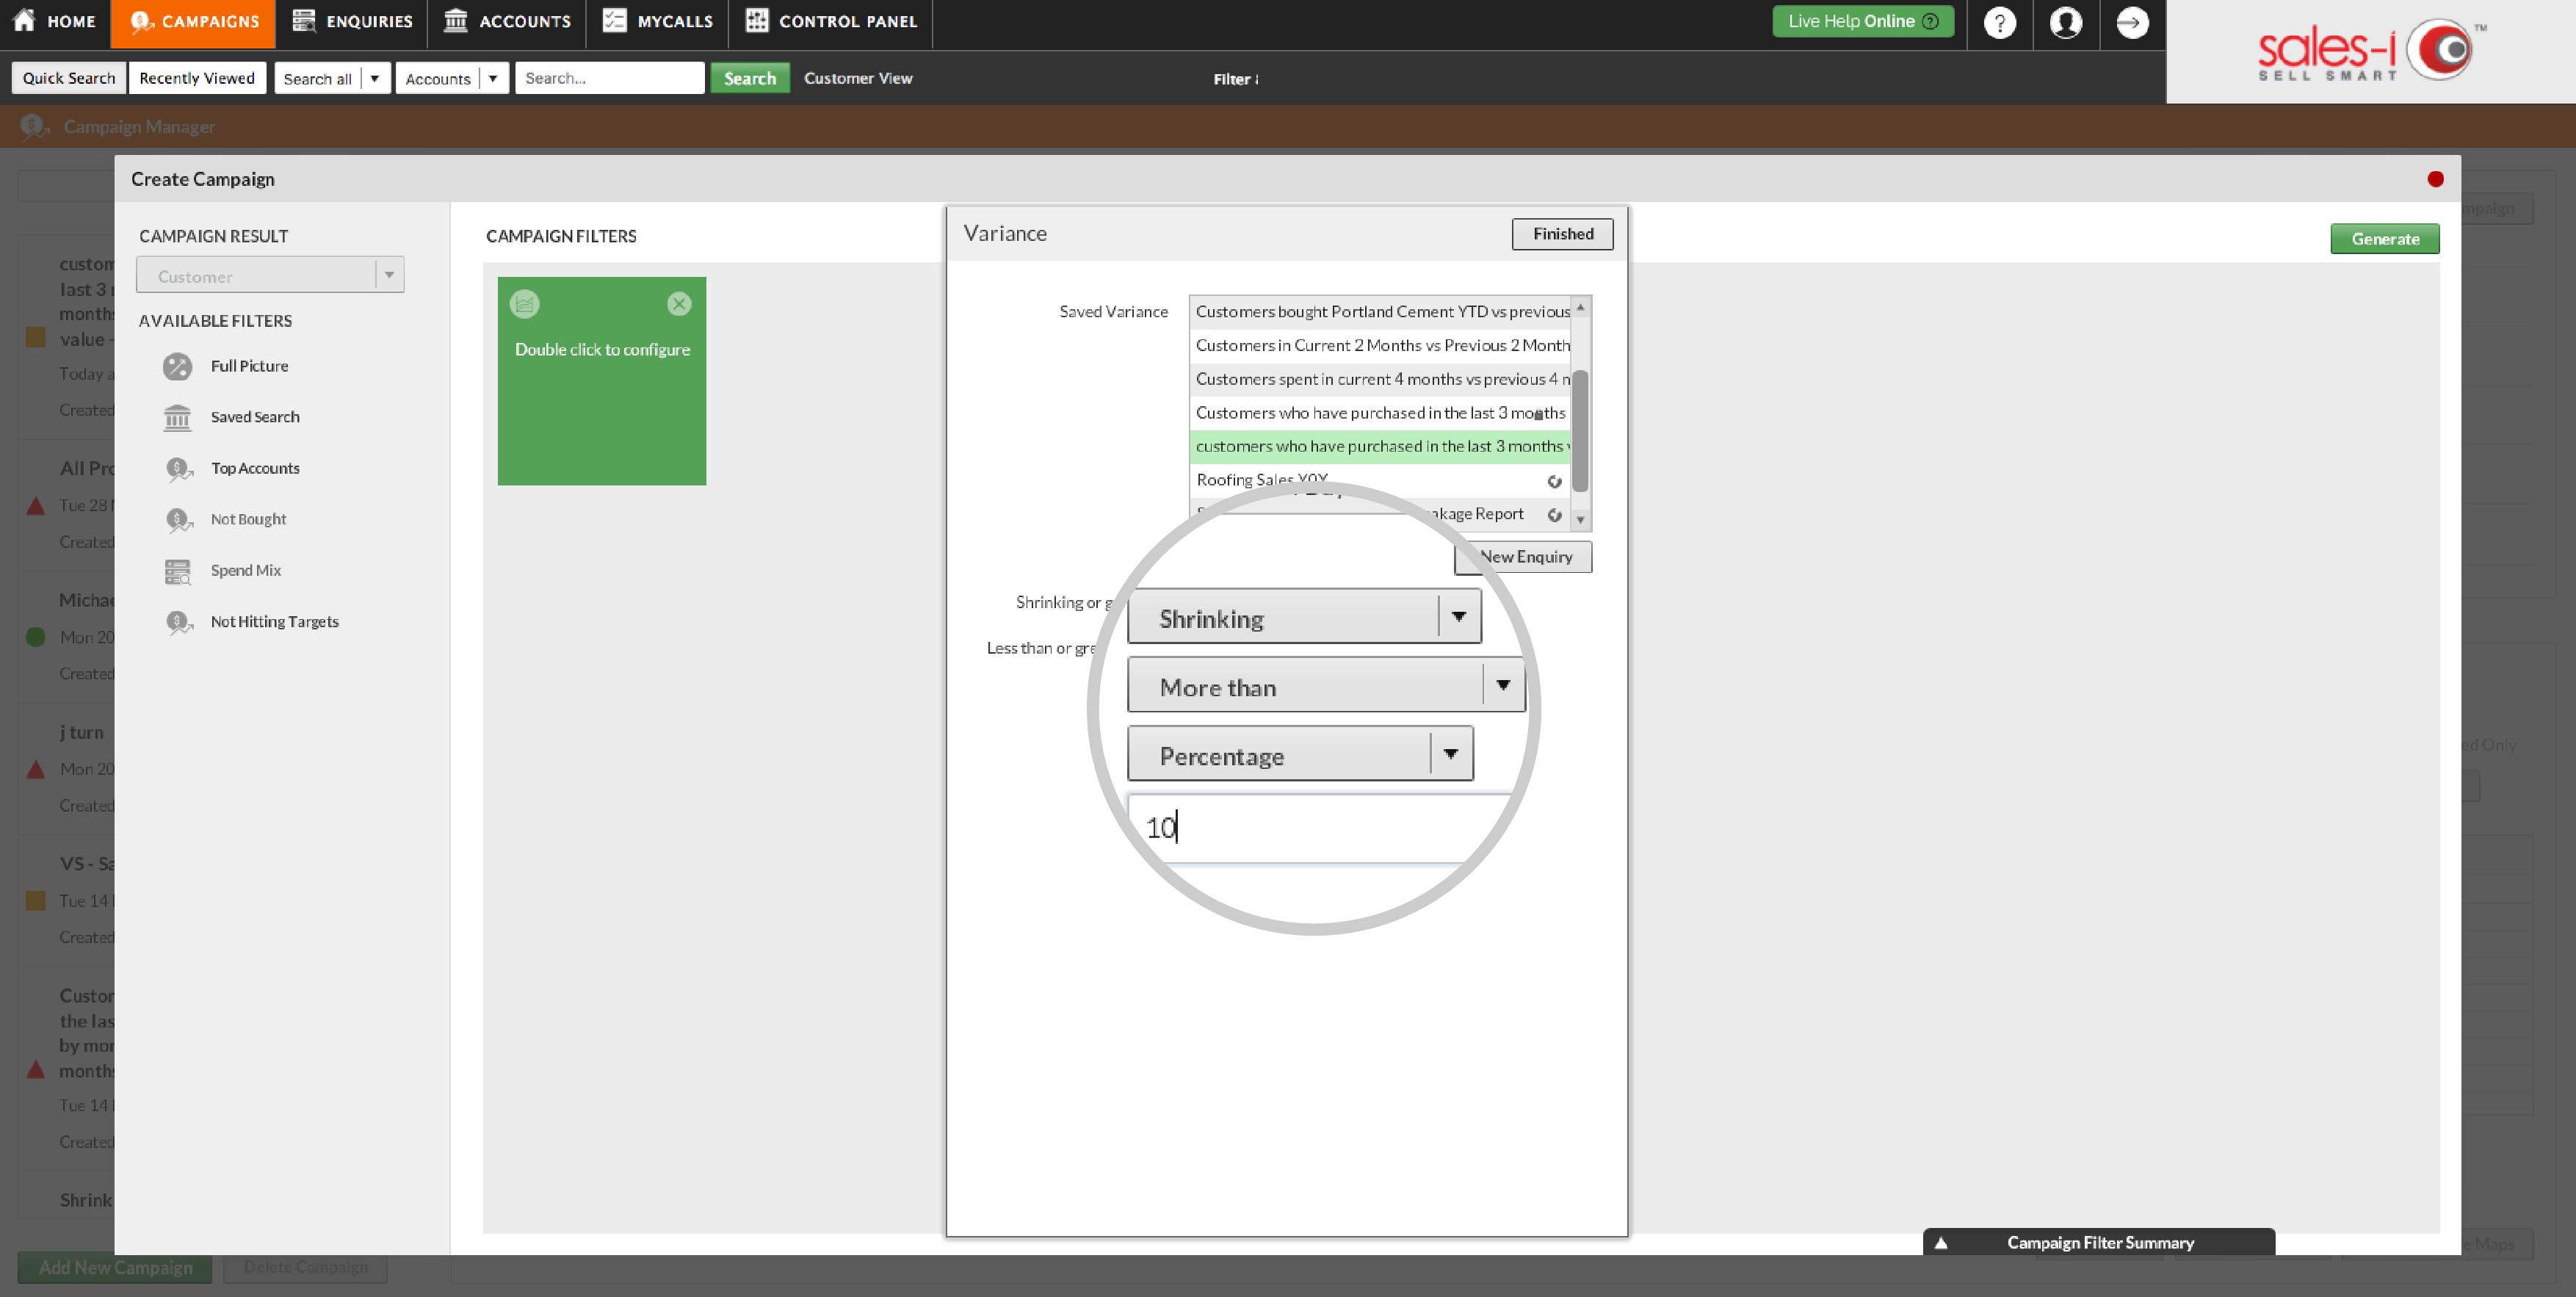
Step 9: Narrow Search
Ensure the recently selected enquiry is highlighted green at the top of the box.
The drop down menus act as a series of questions that will exclude customers from the recently saved enquiry based on your answers.
Options used for this specific campaign:
a. Shrinking
b. More Than
c. Percentage
d. Enter 10 into the last box.
Then press finished.
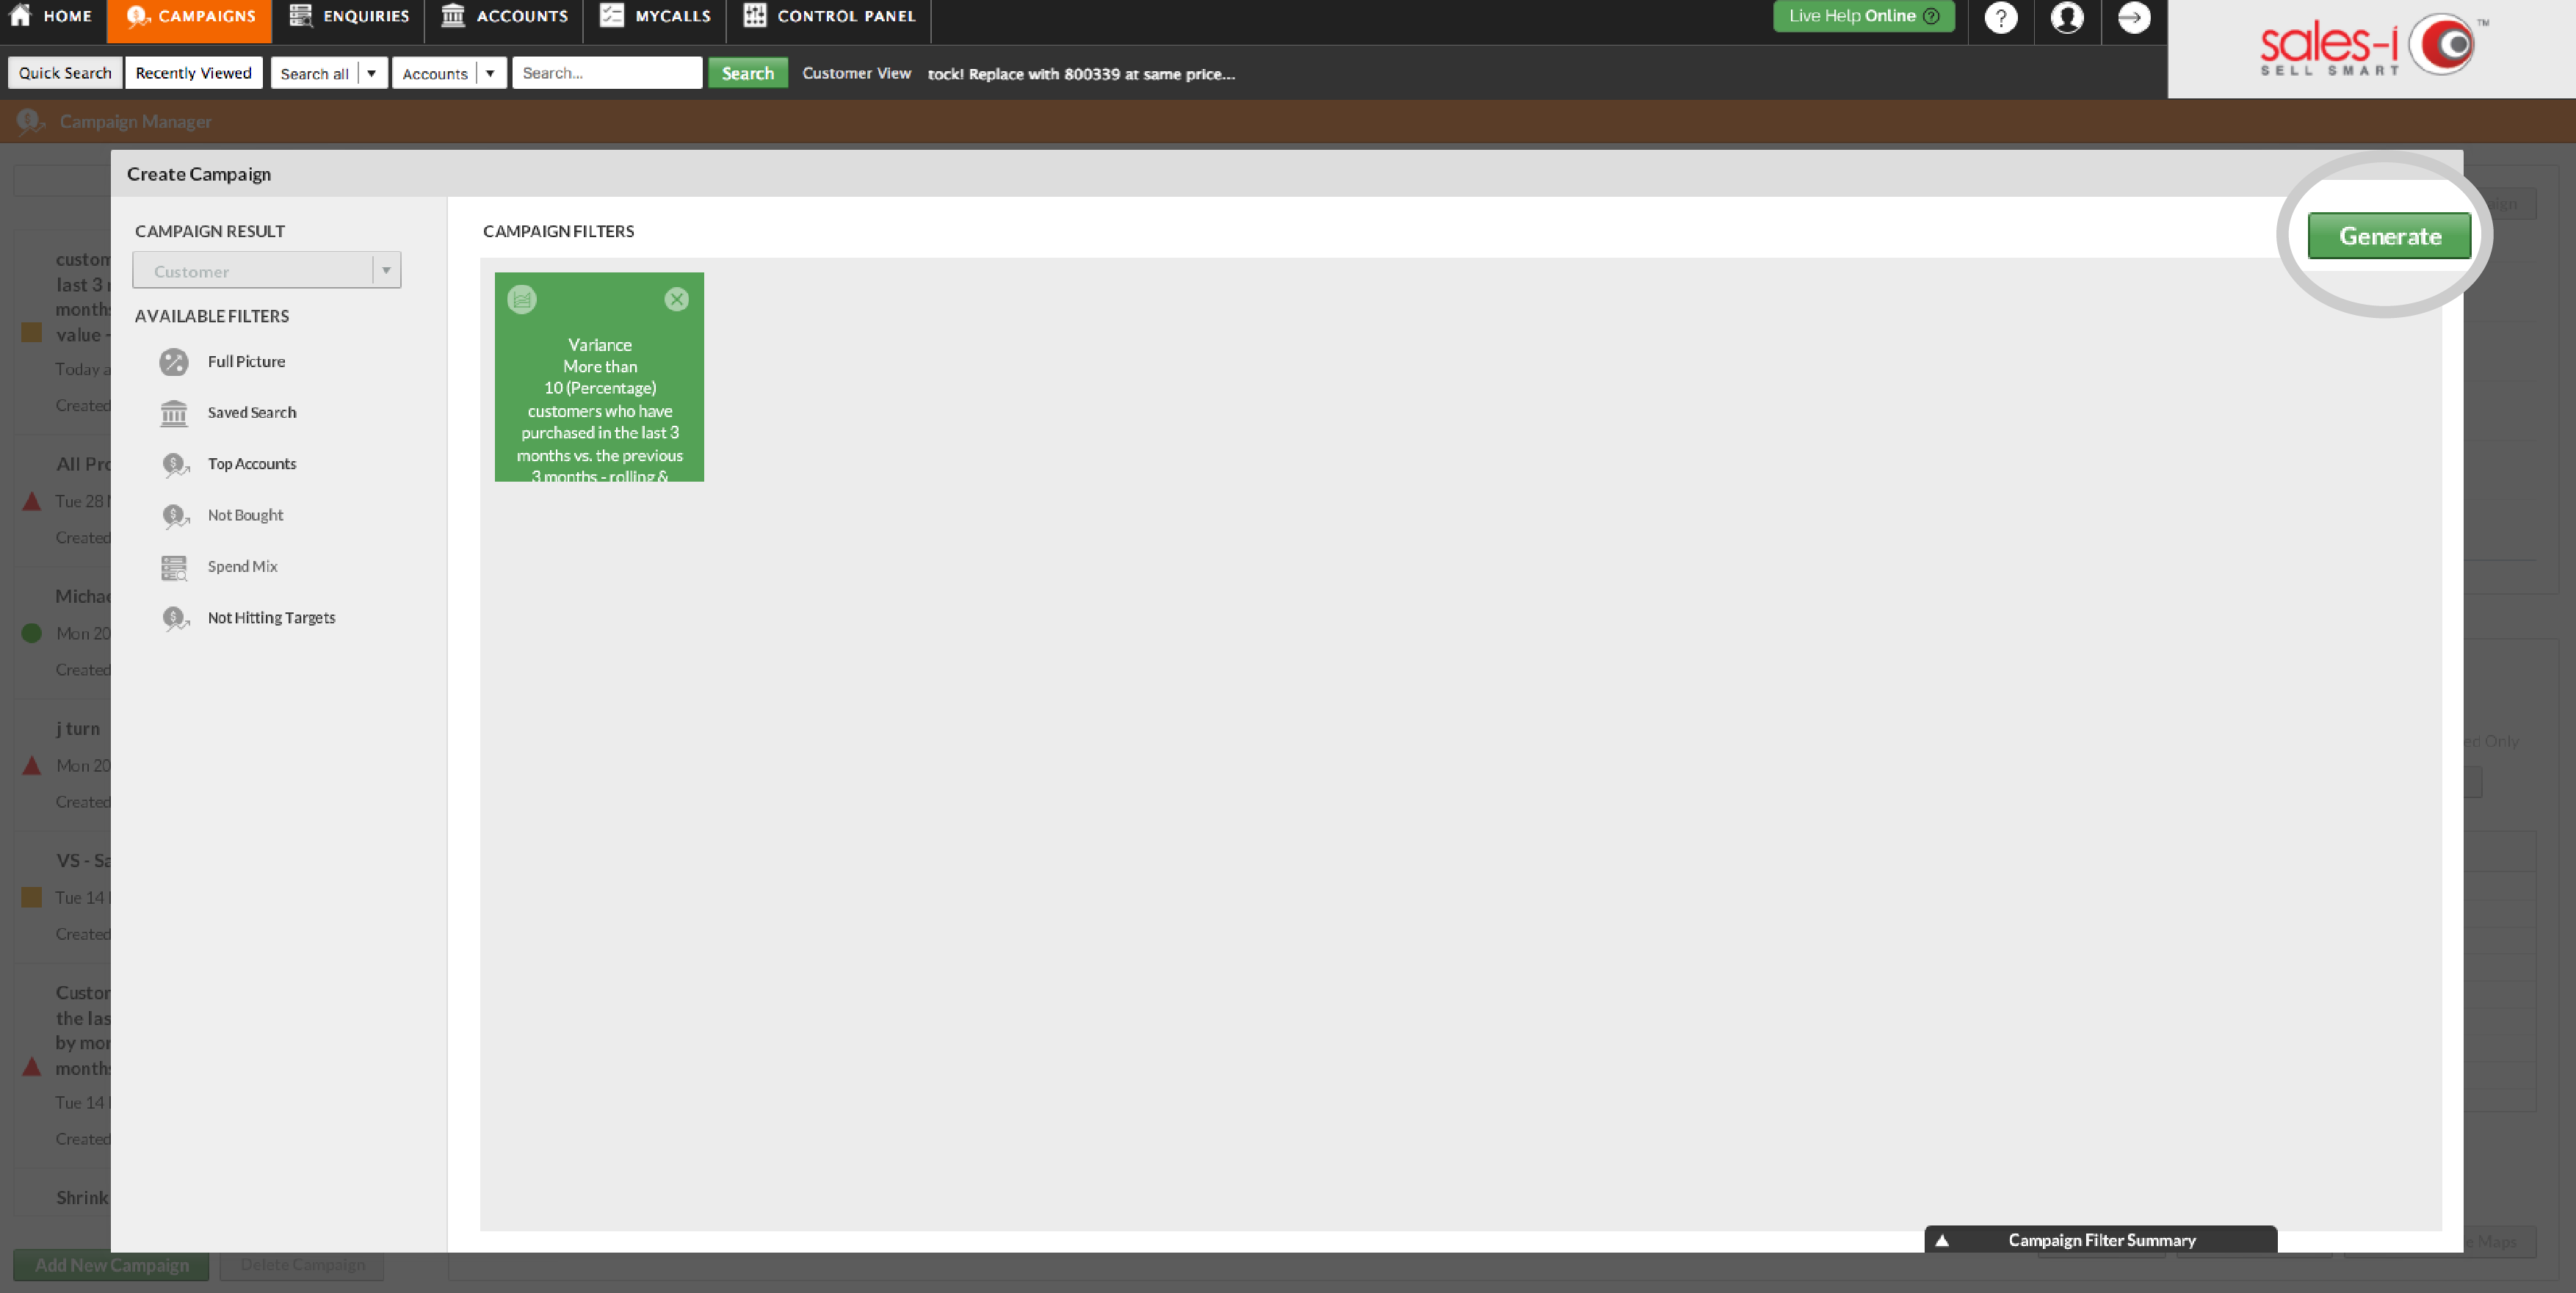
Step 10: Generate Campaign
Press the green Generate button in the top right of the window.*
*Please note: This campaign uses a single filter, other campaigns may use more than one filter. This can be achieved using similar steps as detailed above.
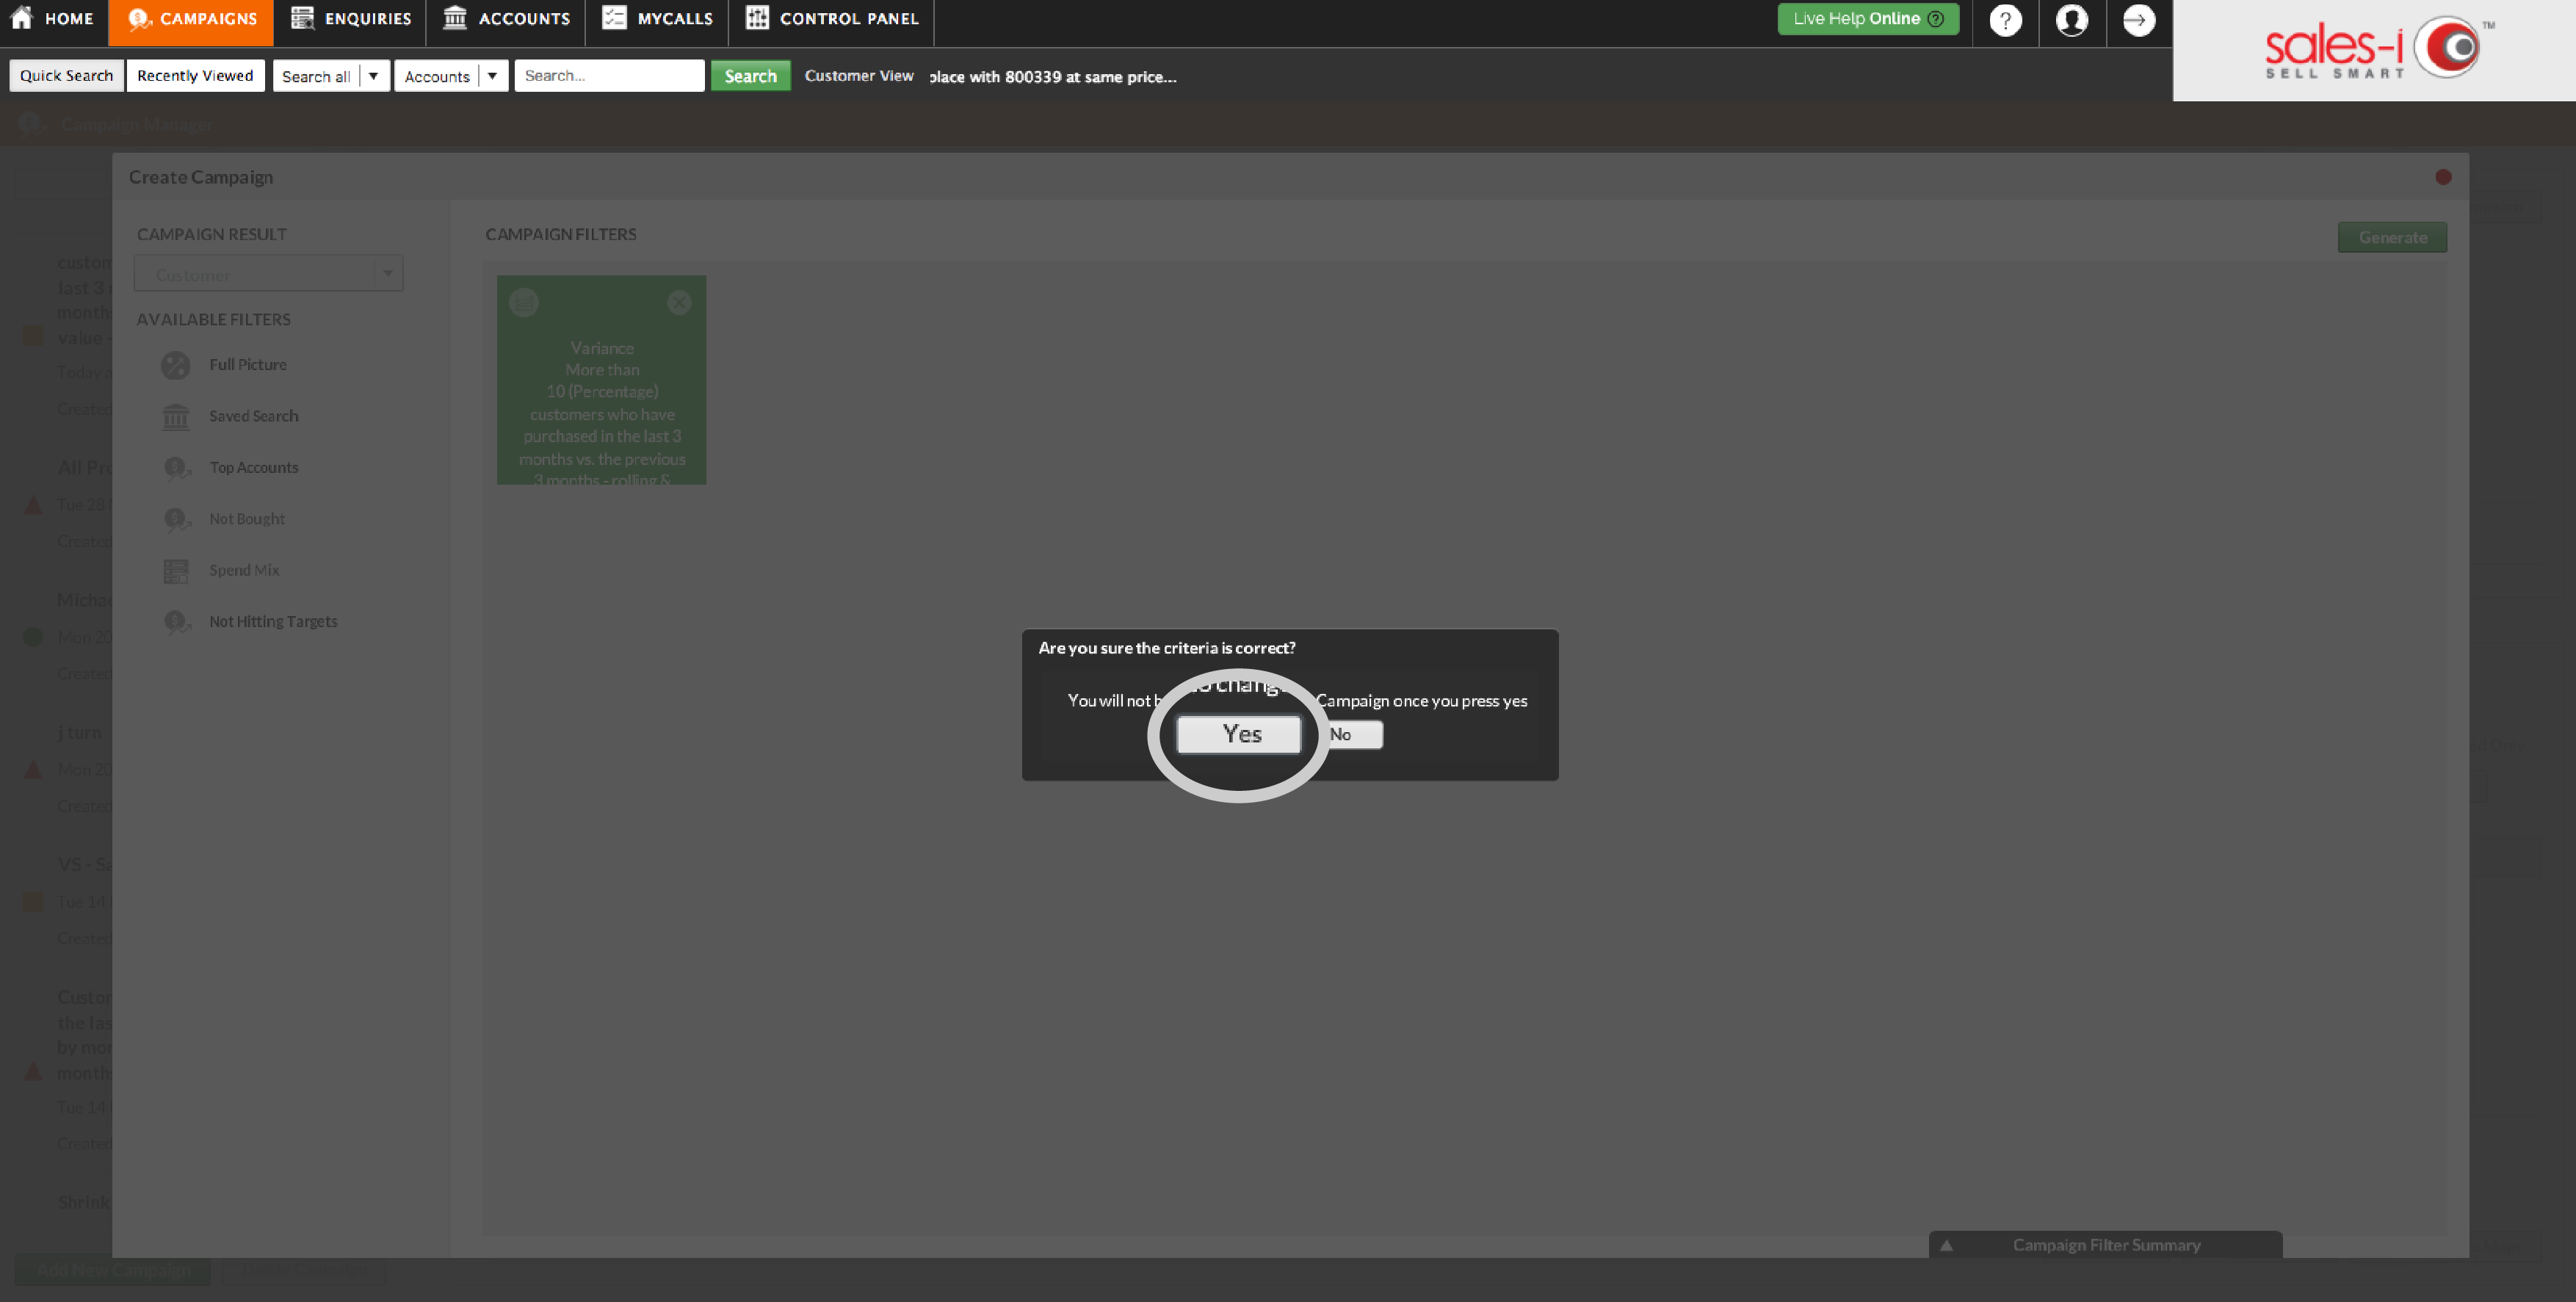
Step 11: Save Campaign
At this stage a black box will appear warning you that you will not be able to change your Campaign once you press Yes.
Click Yes.
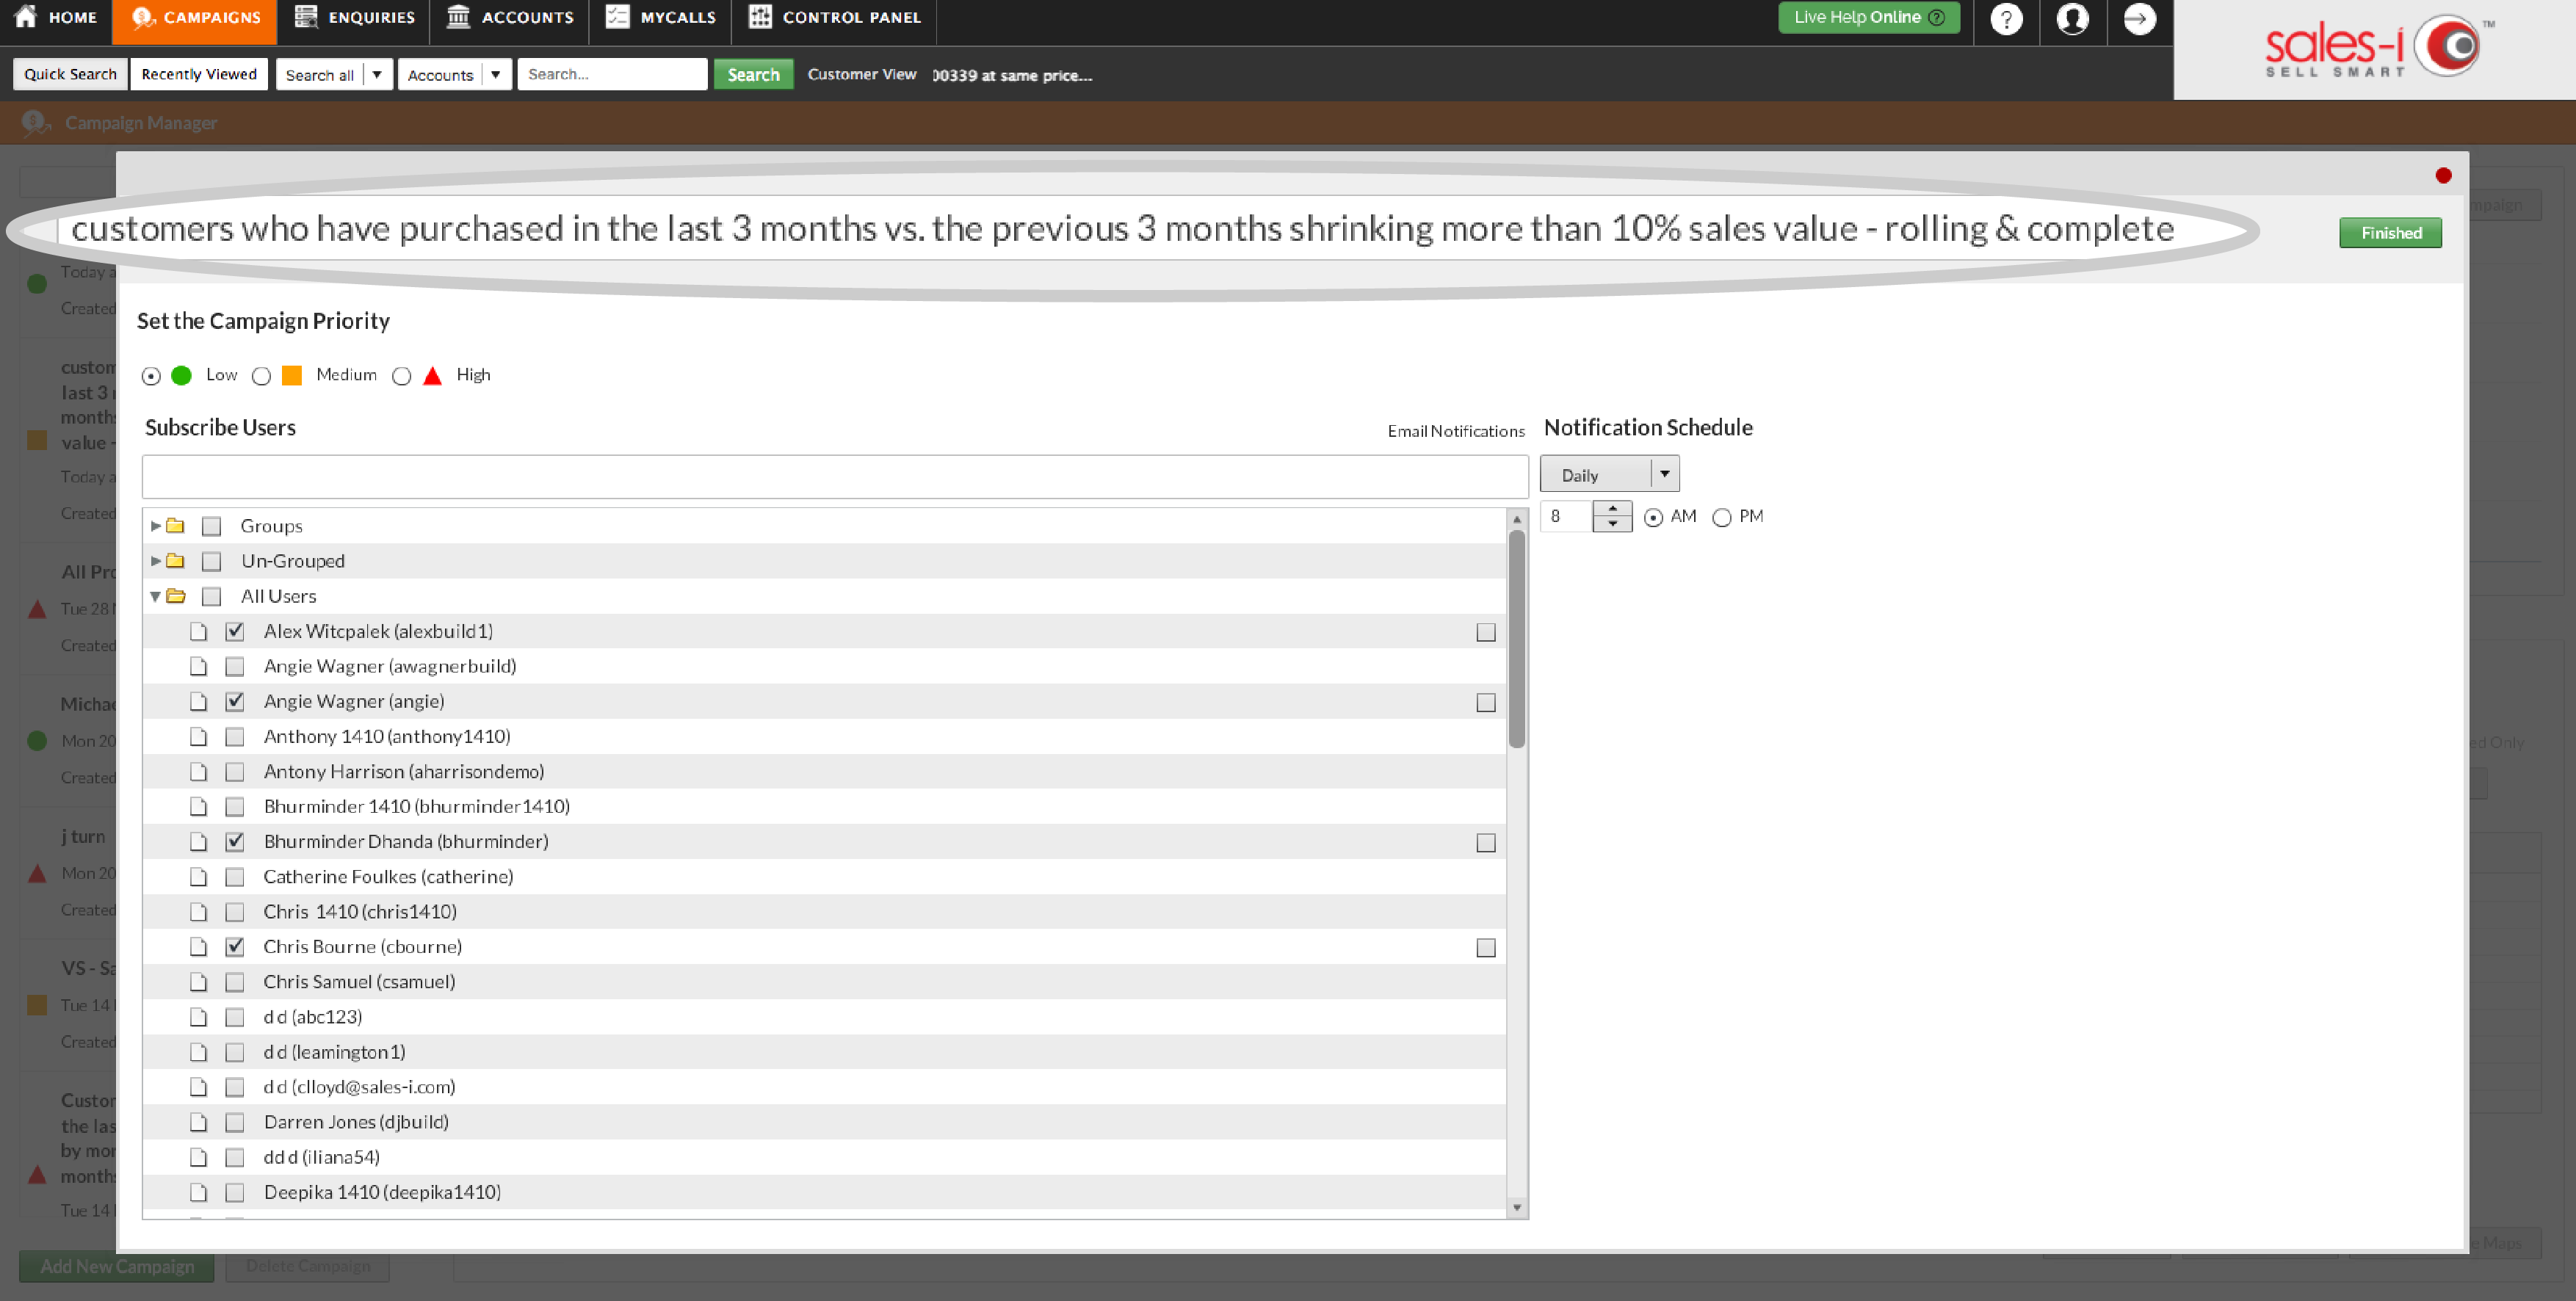
Step 12: Give Campaign a Priority Colour
Name this overall campaign ‘customers who have purchased in the last 3 months vs. the previous 3 months shrinking more than 10% sales value – rolling & complete’.
Using the traffic light system, give your campaign a colour of priority.
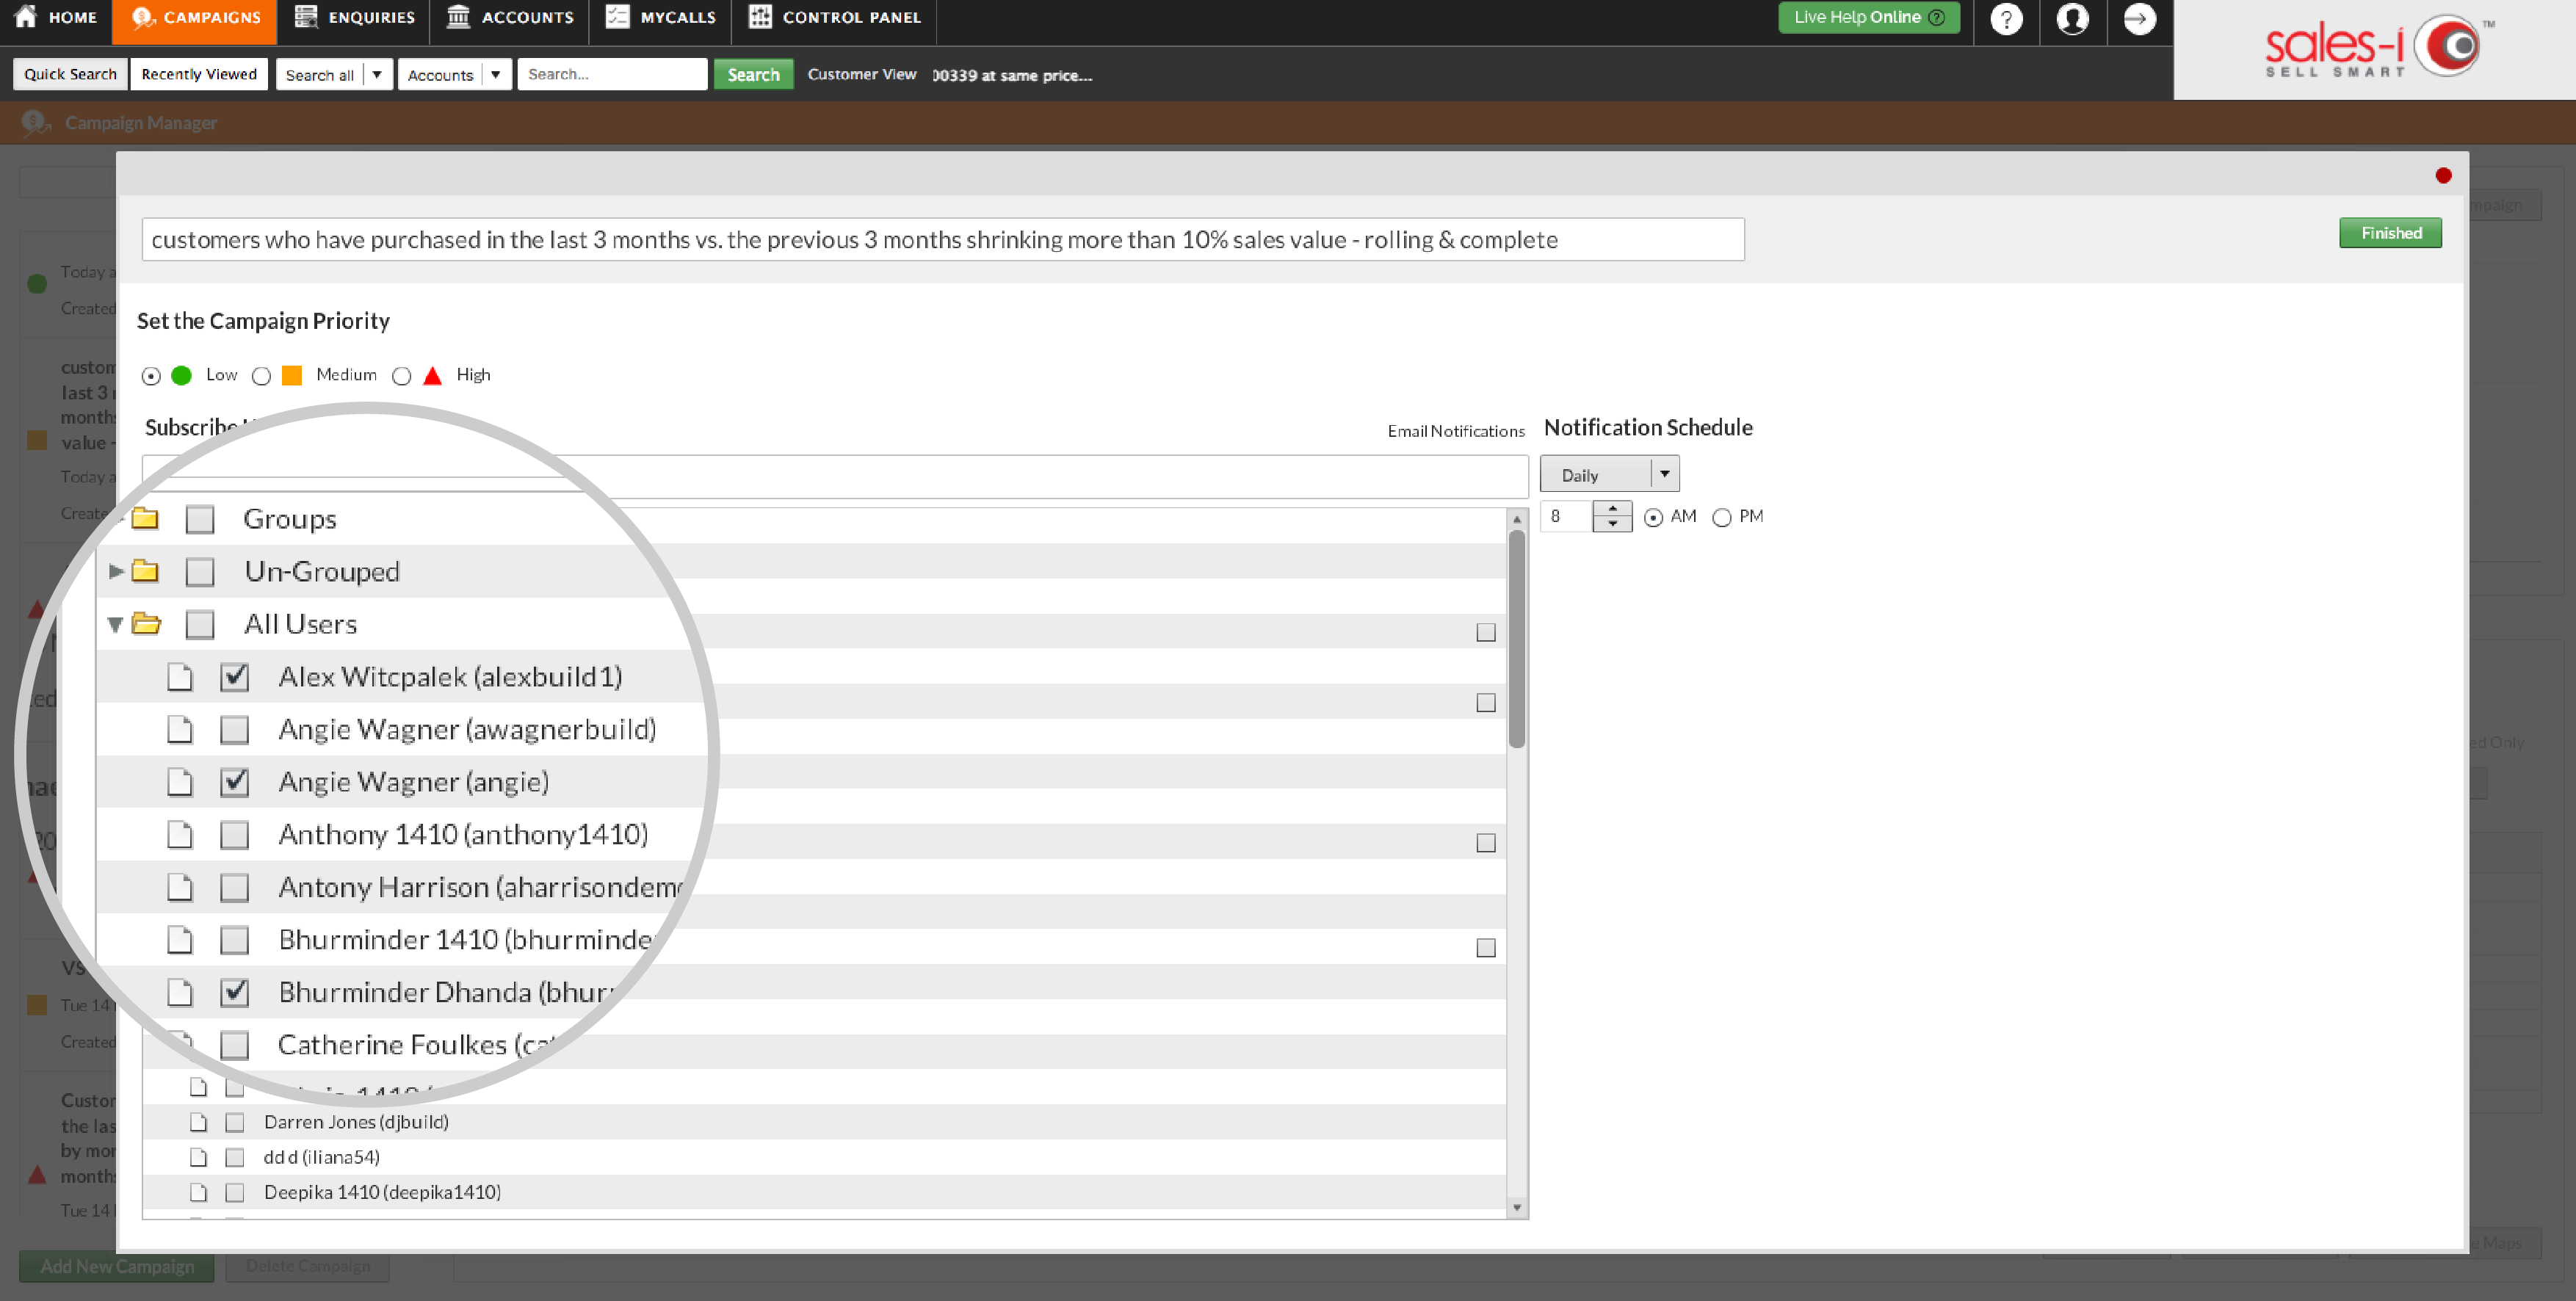
Step 13: Set Access Parameters
Next, select the users you wish to access the campaign results.
Using the grey arrow next to All Users folder, will open up the list of users.
Select the box next to All Users if you wish to allow everybody to access the campaign*
*If used, Groups will assign access to the users included in the relevant group(s).
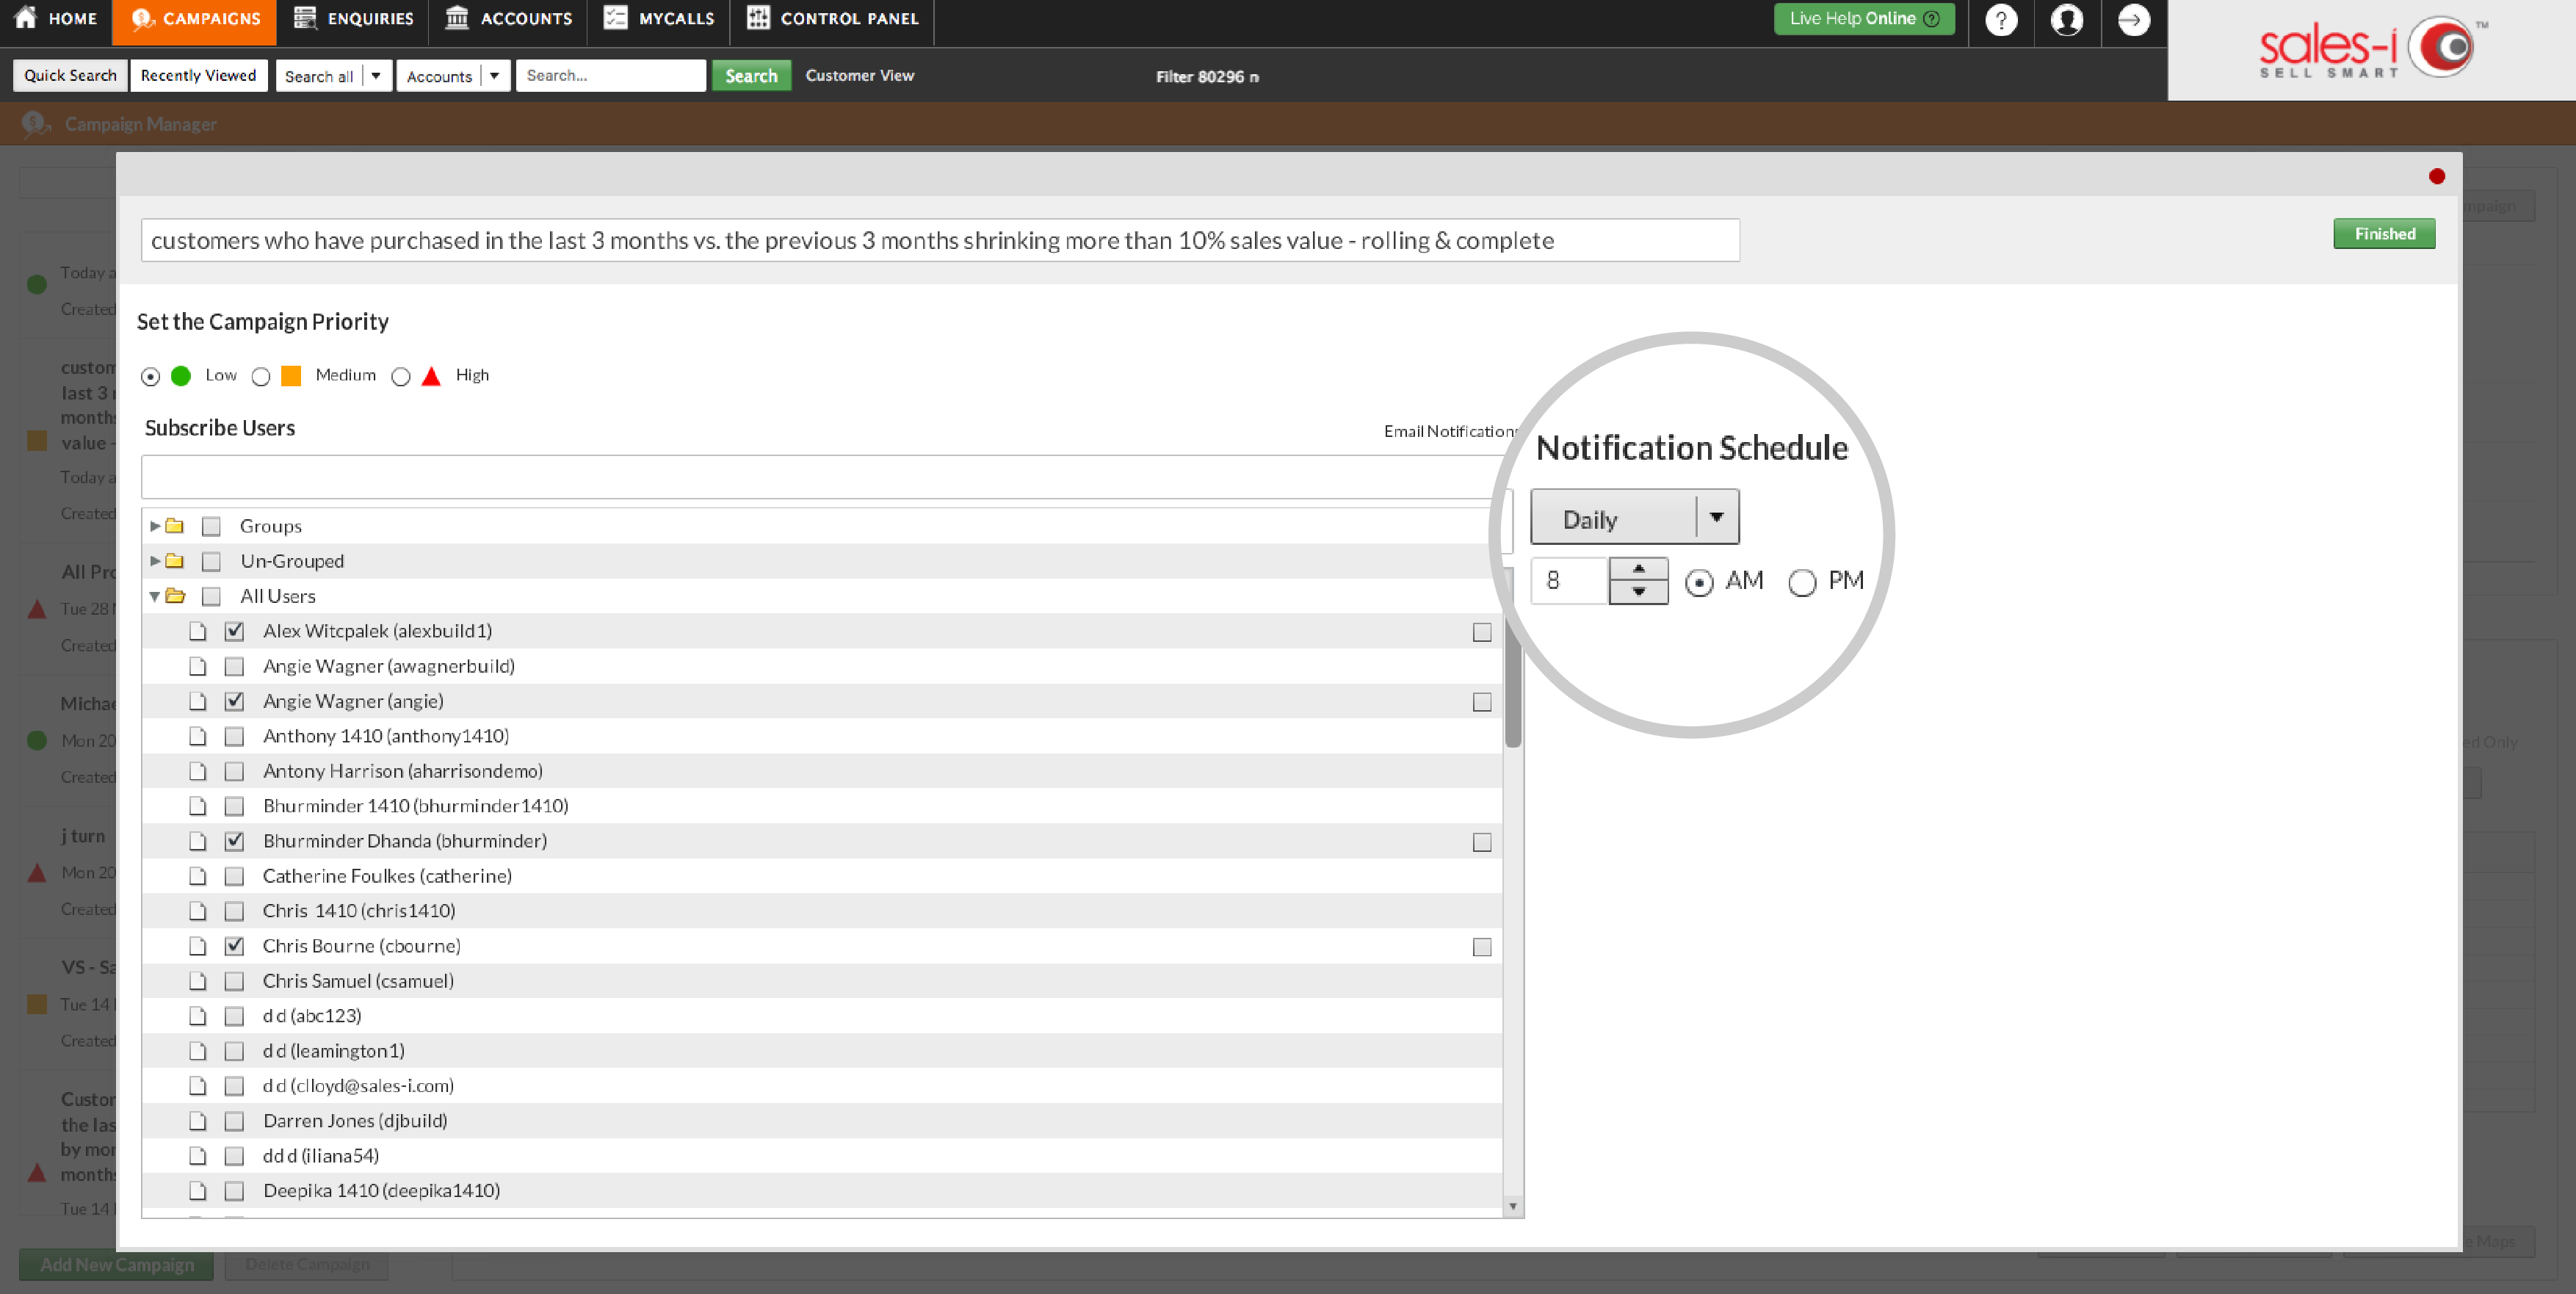
Step 14: Set Schedule of Campaign
When you’re ready to move on, click finished.
This section is editable for name, priority and user selection.
Optional: The tick box to the right of the user(s) selected to access the campaign is an optional email notification reminder.
Under Notification Schedule, select the frequency you would like an email reminder to run the campaign to be sent out.
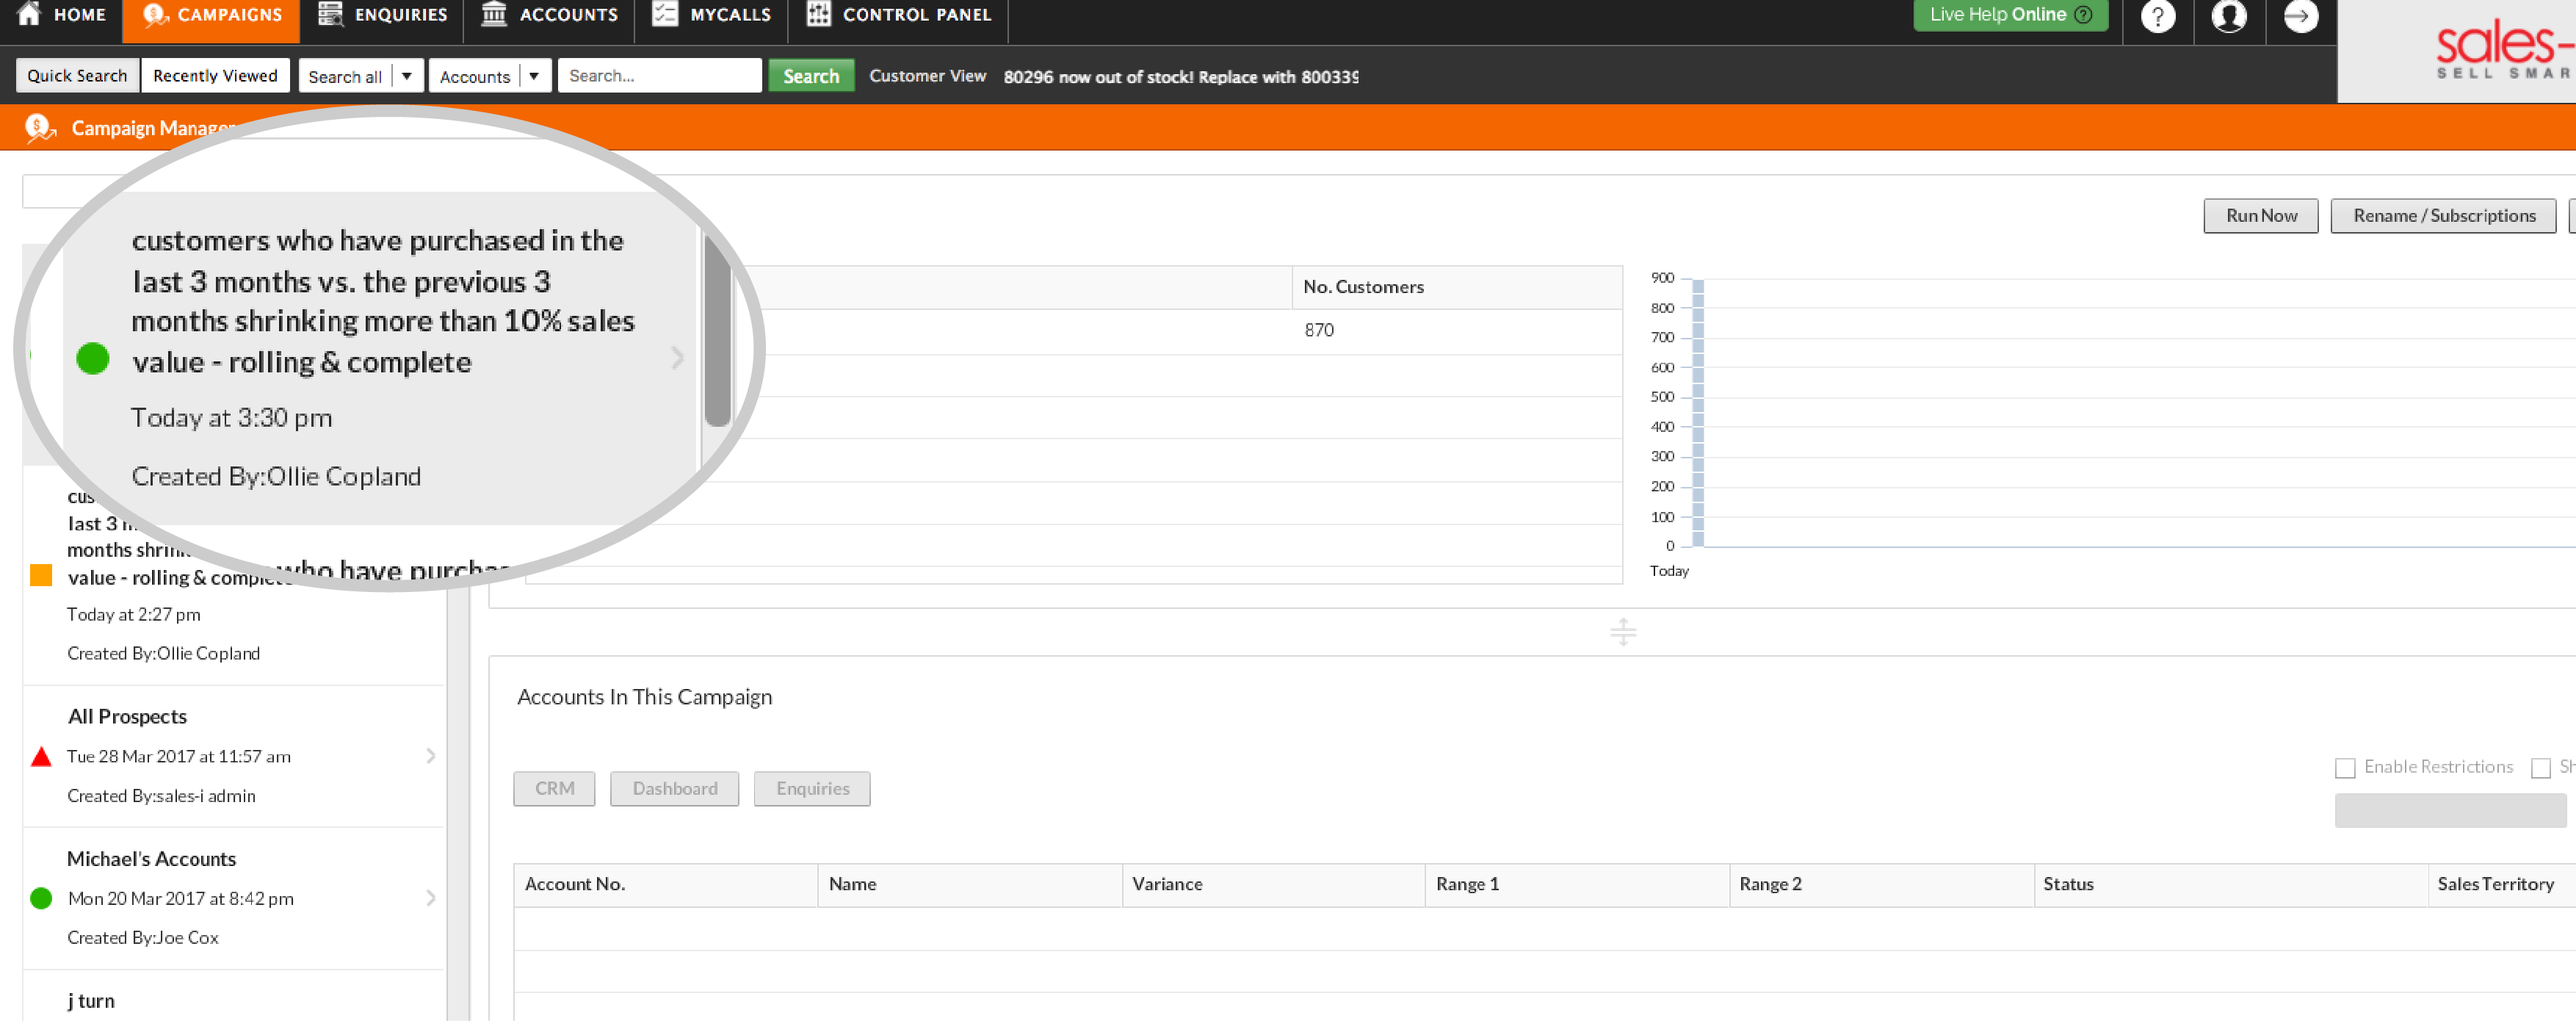
Step 15: See Campaign Results
To view the results of this campaign, click on its title in the menu on the left.*
*Please note: Only the Power user can see the date processed tab and associated line graph.
Select Date Processed to see the results.
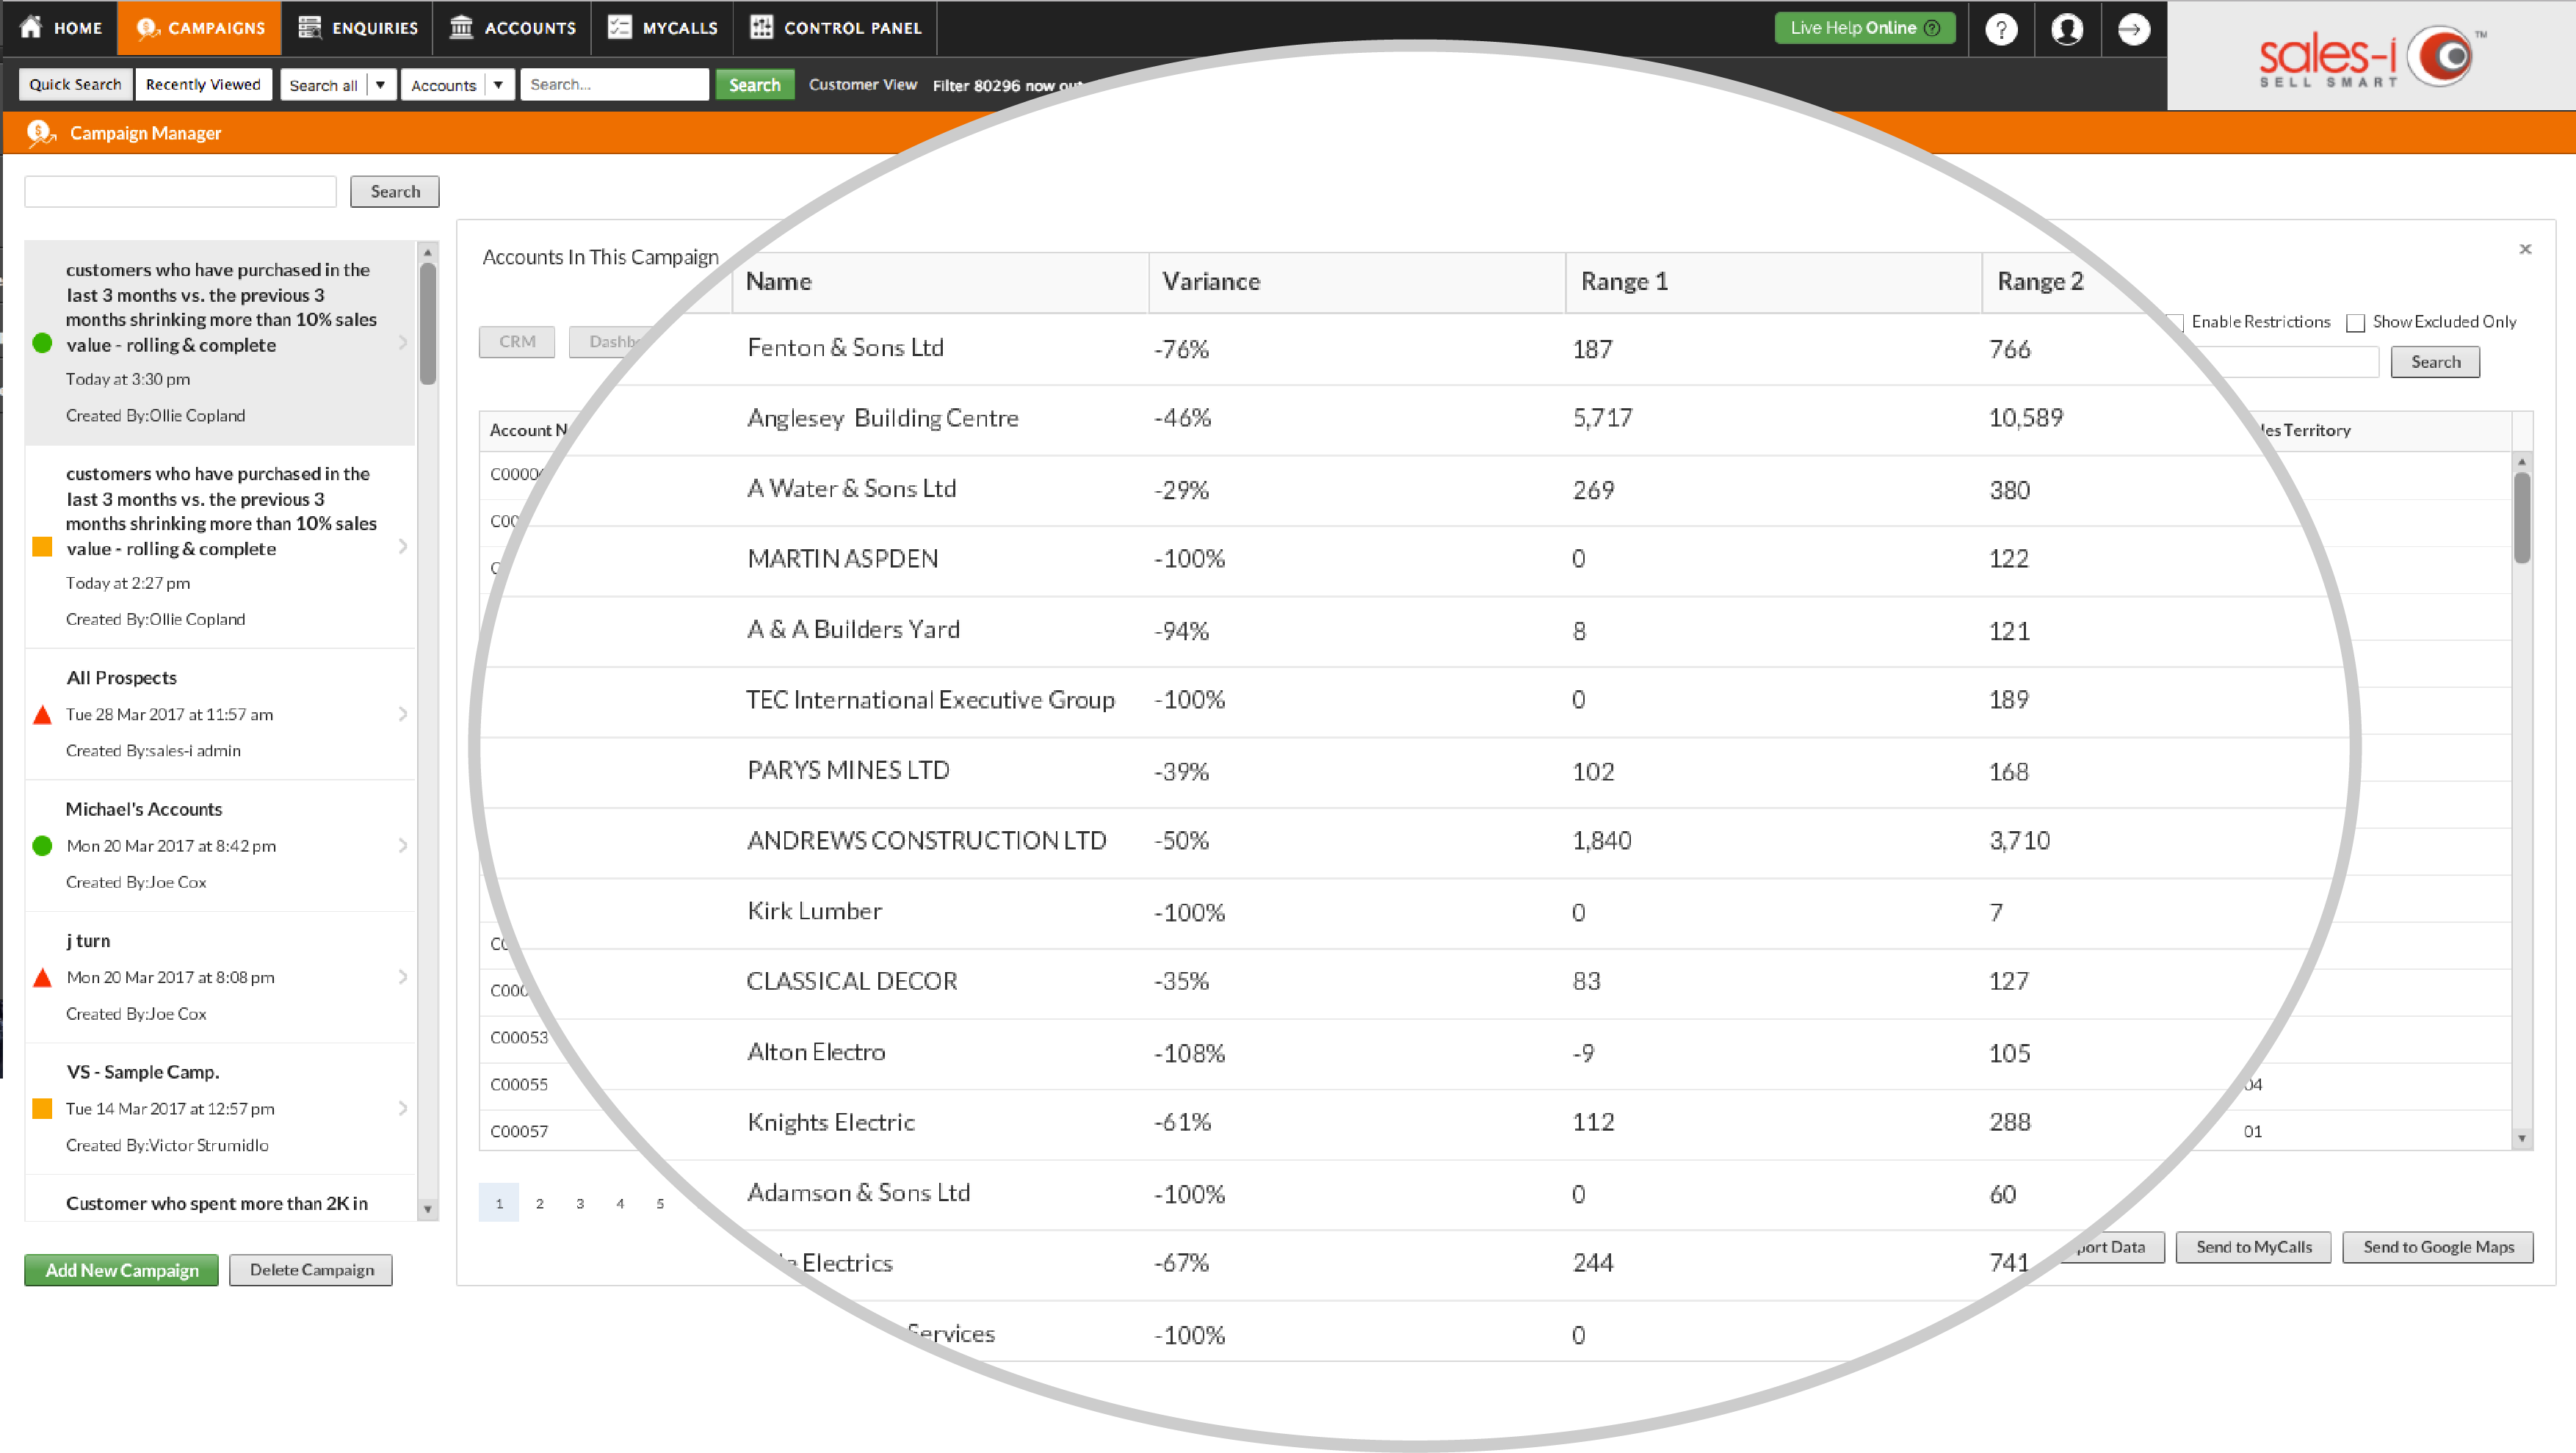
Step 16: Adjust Filters
You will now see a list of companies. The Variance column shows how much their spend has fallen by a percentage over the last 3 months.*
Range 1 is the closest date range to the current date.
Range 2 is the furthest date range from the current date.
*Please note: Clicking the header of a column will sort by ascending or descending order.