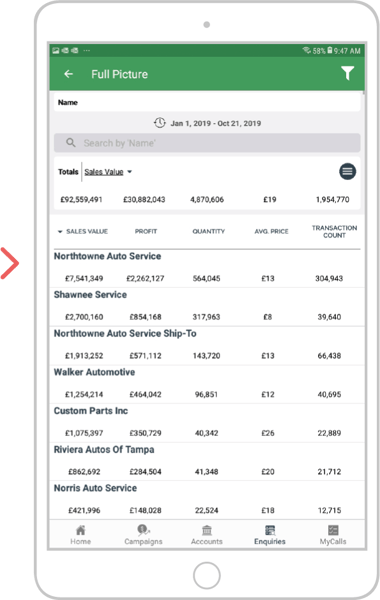
The Enquiries section allows you to see detailed customer, product and transactional data in a variety of different ways. There are several types of Enquiries screens, which all work in a similar way, but each display information in a different way.
Select a device
Desktop
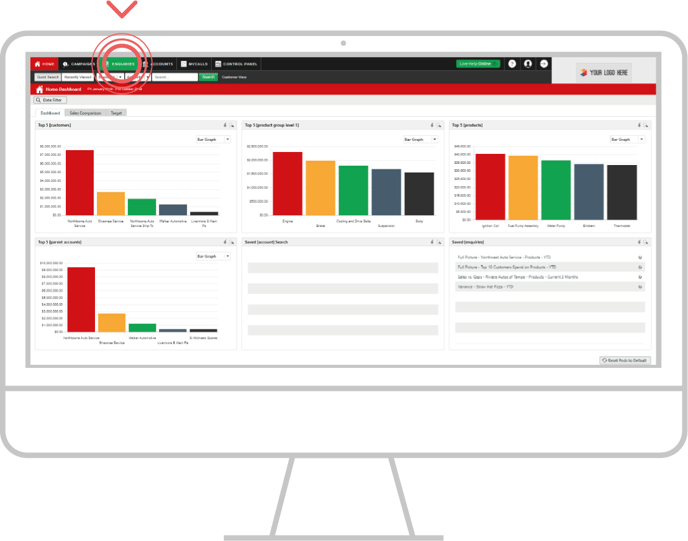
Step 1: Go to Enquiries
From the black navigation bar at the top of the screen, click Enquiries.
Step 2: Enquiry type
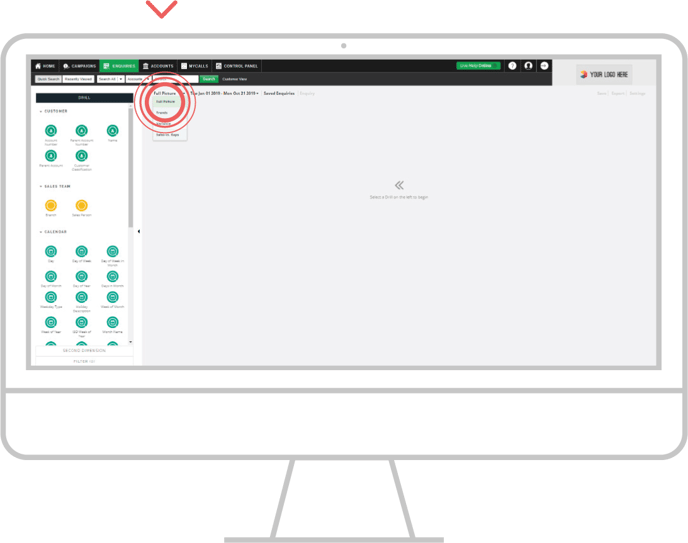
Clicking the drop-down option will show you the available Enquiry types.
Full Picture is the default report and will show multiple measurements on the screen at the same time, for example, Value, Cost and GP.
Variance will present your sales data as a comparison between two selected date periods.
Trends will give you a graphical interpretation of your business overall with this year and last year depicted by colored lines.
Sales v Gaps shows the monthly, weekly, or daily breakdown of sales over a date range.
In this example, click on Full Picture.
Step 3: Data results
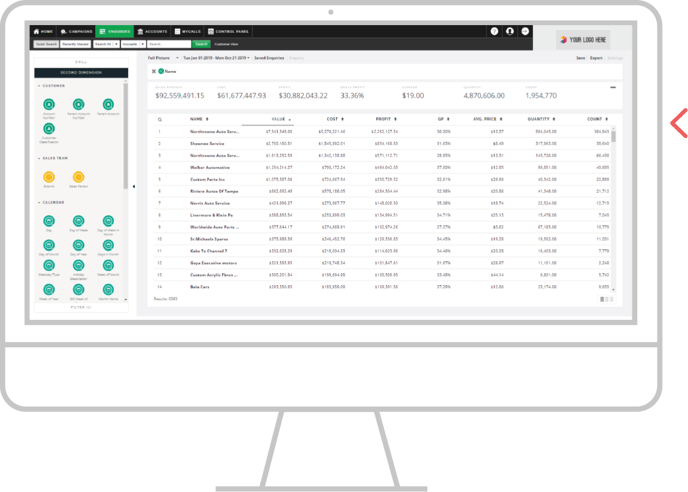
Once you have selected the type of report you require, go to the panel on left hand side of the screen. Here you will see a series of drill bubbles, each providing a way to drill into your data.
In this example, we have used Name, to see a list of all your customers ordered typically in value depending on the report selected.
Apple
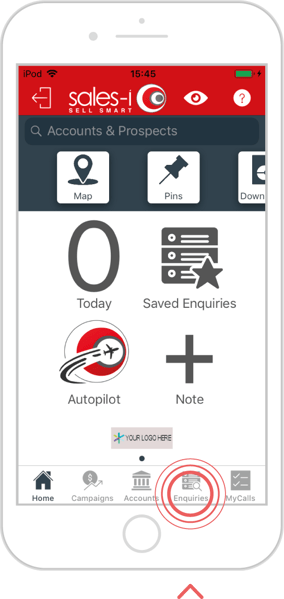
Step 1: Enquiries
From the bottom navigation select the Enquiries Tab.
Step 2: Enquiry types
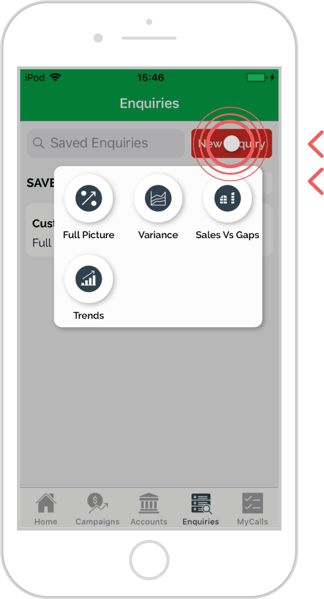
Clicking red New Enquiry button in the top right of the page, will show you the available Enquiry types.
Full Picture is the default report and will show multiple measurements on the screen at the same time, for example Value, Cost and GP.
Step 3: Enquiry types
Variance will present yours sales data as a comparison between two selected date periods.
Trends, will give you a graphical interpretation of your business overall with this year and last year depicted by coloured lines.
Sales v Gaps shows the monthly, weekly, or daily breakdown of sales over a date range.
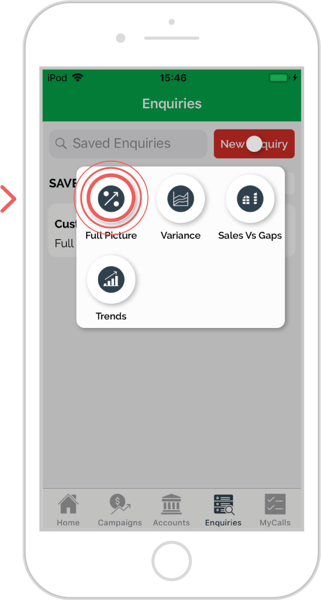
In this example, click on Full Picture.
Step 4: View totals
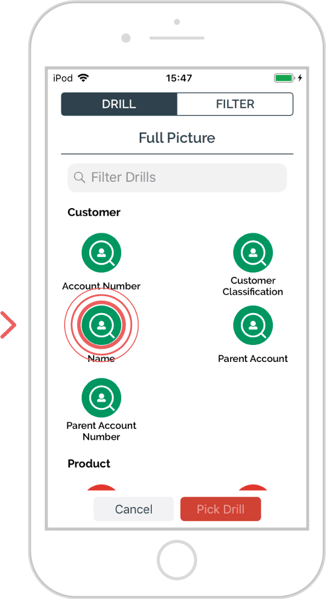
Once you have selected the type of report you require, here you will see a series of drill bubbles, each providing a way to drill into your data.
In this example, click on the Name bubble.
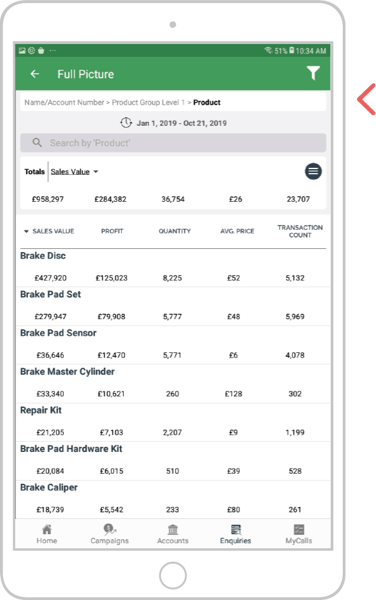
Step 5: Results
This selected will provide a list of all your customers, ordered typically in value depending on the report selected.
Android
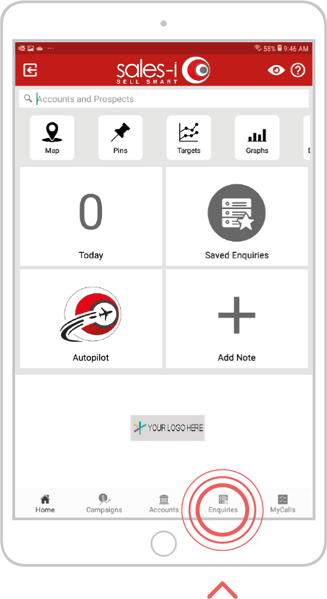
Step 1: Enquiries
From the bottom navigation select the Enquiries Tab.
Step 2: Enquiry types
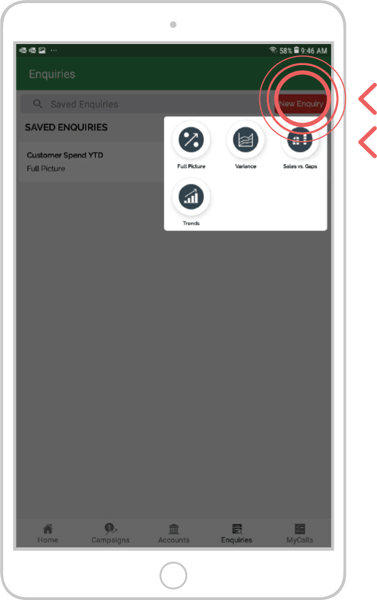
Clicking red New Enquiry button in the top right of the page, will show you the available Enquiry types.
Full Picture is the default report and will show multiple measurements on the screen at the same time, for example Value, Cost and GP.
Step 3: Enquiry types
Variance will present yours sales data as a comparison between two selected date periods.
Trends, will give you a graphical interpretation of your business overall with this year and last year depicted by coloured lines.
Sales v Gaps shows the monthly, weekly, or daily breakdown of sales over a date range.
In this example, click on Full Picture.
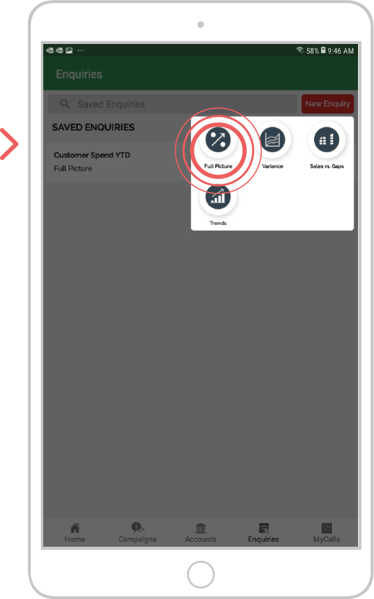
Step 4: View totals
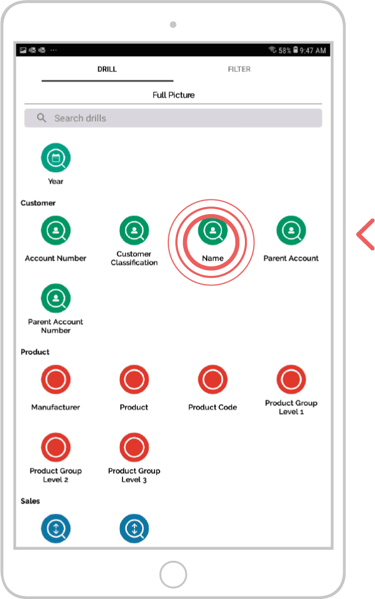
Once you have selected the type of report you require, here you will see a series of drill bubbles, each providing a way to drill into your data.
In this example, click on the Name bubble.
Step 5: Results
This selected will provide a list of all your customers, ordered typically in value depending on the report selected.
