The Variance Enquiry within sales-i allows you to compare over two different date ranges to find any rise or to stop any leakage in spend.
This guide will show you how to use this enquiry to see a list of customers who are spending less with you allowing you to protect and improve sales growth.
Select a device
Desktop
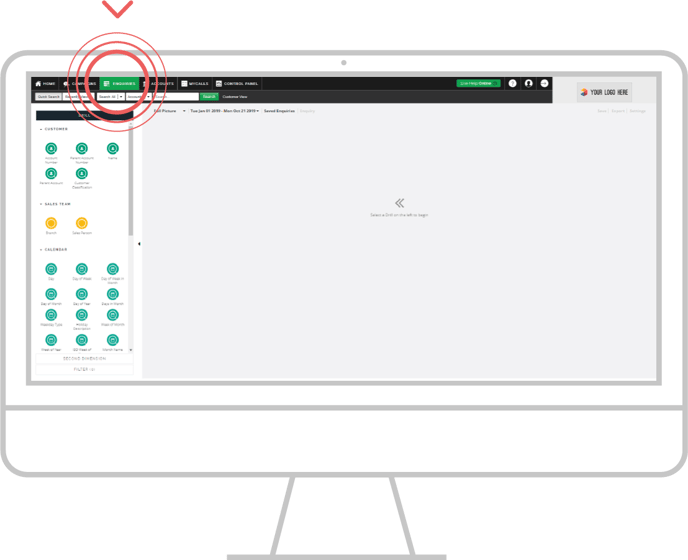
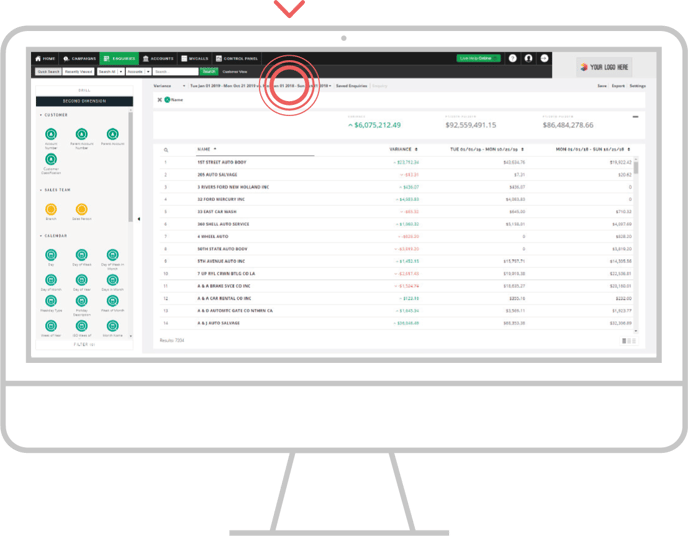
Step 1: Click Enquiries
Click Enquiries from the top black navigation.
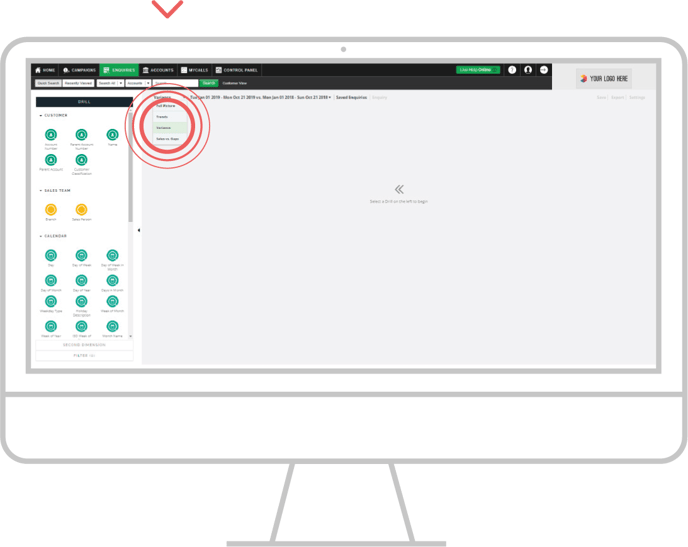
Step 2: Click drop down
This will give you a choice of report types.
Select Variance from the drop down list as this enquiry type is the only enquiry with two different date ranges.
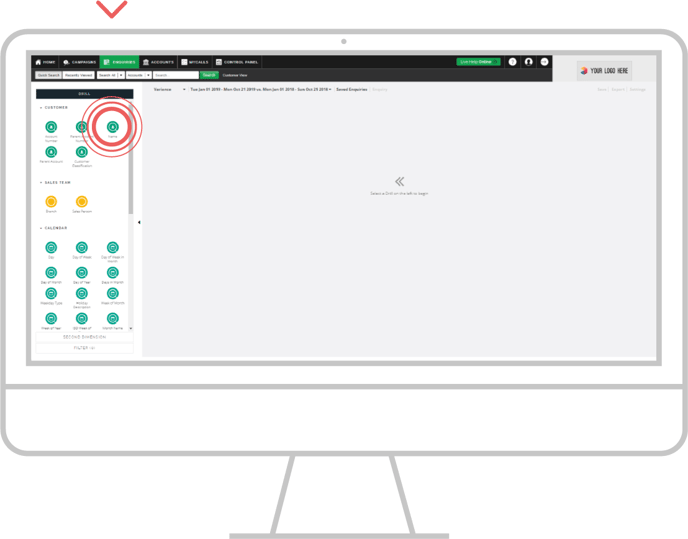
Step 3: Search
Click on the Name bubble to view a list of your customers.
Note: Name shows spend for sub-accounts.
Alternatively, you can use the Parent Account bubble to roll up spend for all of the Sub Accounts that are associated into one parent Account.
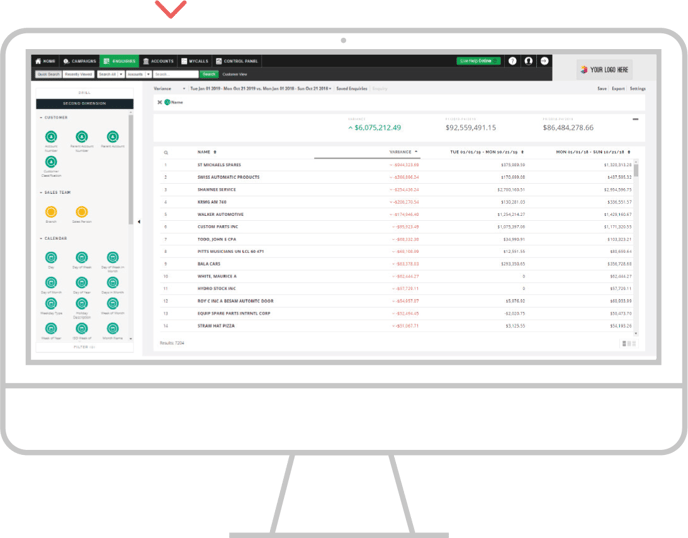
Step 4: Results
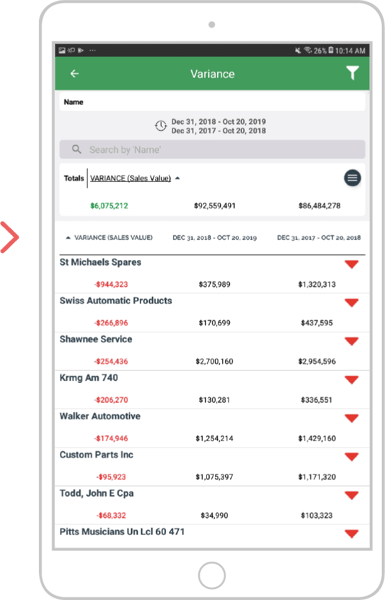
sales-i will default to show your biggest shrinking customer first YTD vs the PYTD and the variance between those two figures.
These are your customers that are spending less year on year.
Note: You can click on any of the table headers to sort them in alphabetical, spend this year, spend last year, ascending or descending order. You will know which column you have selected by checking the pointer in the column header.
Step 5: Top tip
Should you wish to select different date ranges, click on the date range towards the top of the Enquiries screen and choosing a new date range selecting apply, will change the comparison ranges accordingly.
Apple
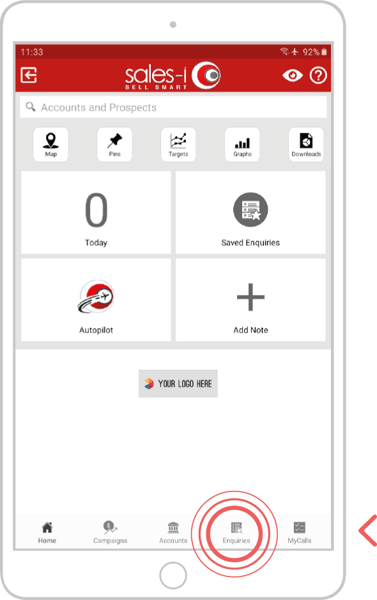
Step 1: Click Enquiries
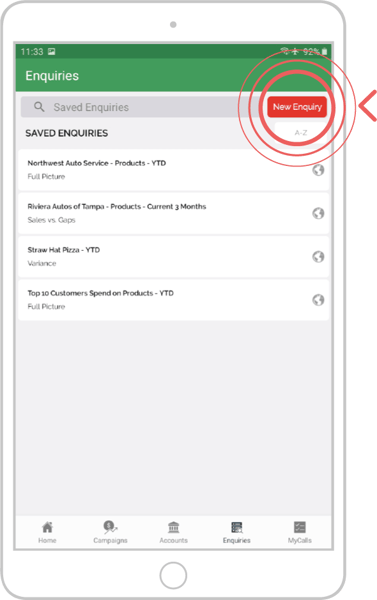
From the navigation bar at the bottom of your screen, tap ‘Enquiries’
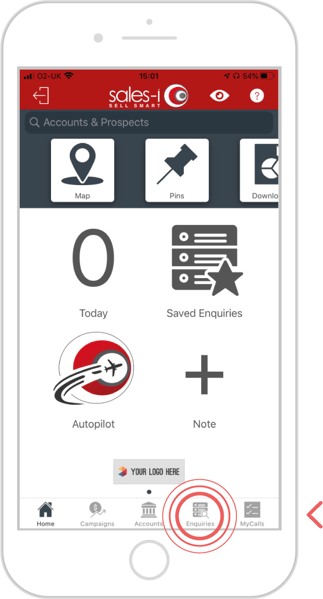
Step 2: Click drop down
Here you can choose whether to dive into an already saved enquiry or to start a new enquiry.
Tap the red ‘New Enquiry’ button on the top left of your screen.
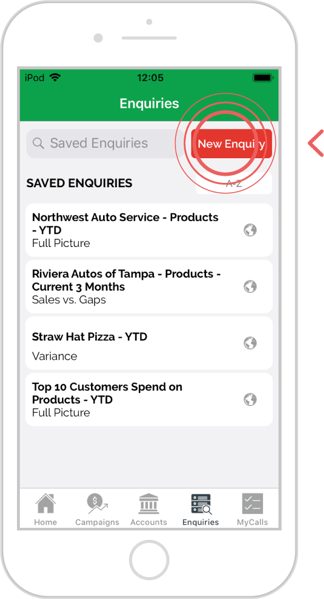
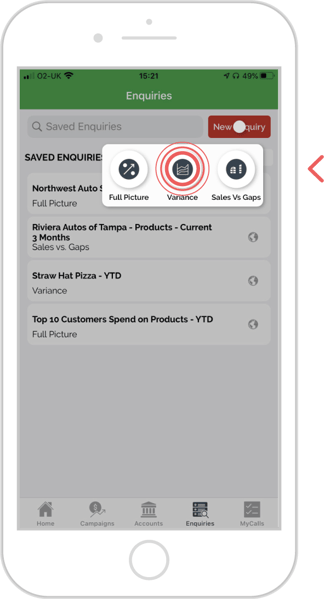
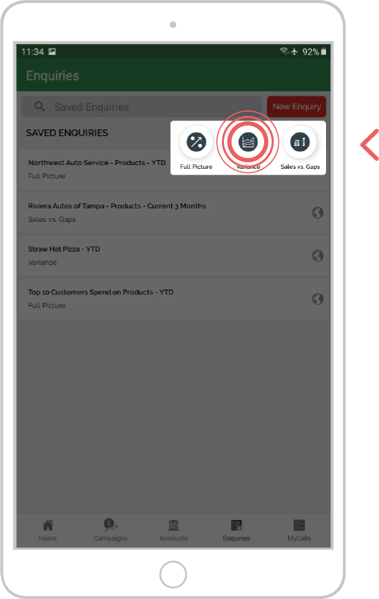
Step 3: Search
Tapping this button will then give you 3 enquiries to choose from.
Tap on Variance.
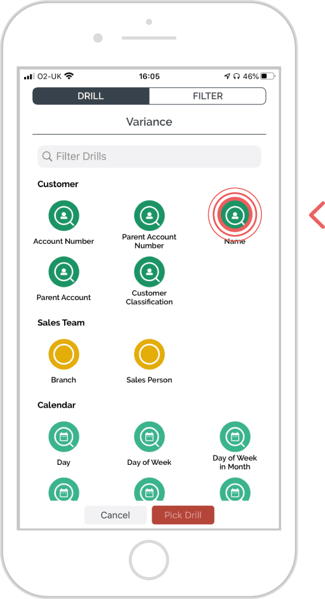
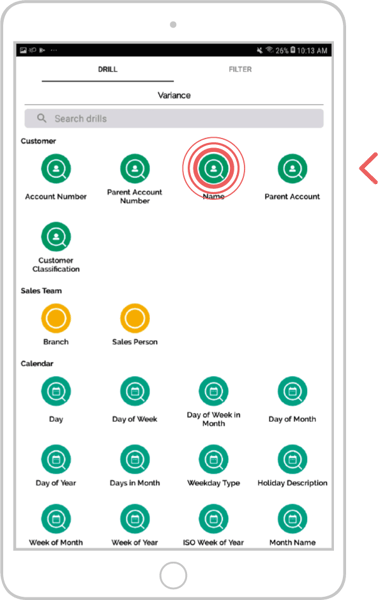
Step 4: Choose bubble
Here you will see your data analysis bubbles.
These bubbles are broken down into 5 analysis fields. Customer, Sales Team, Calendar, Sales and Product.
Scroll down your screen to see more bubbles. In the Customer Analysis Field, tap the ‘Name’ bubble.
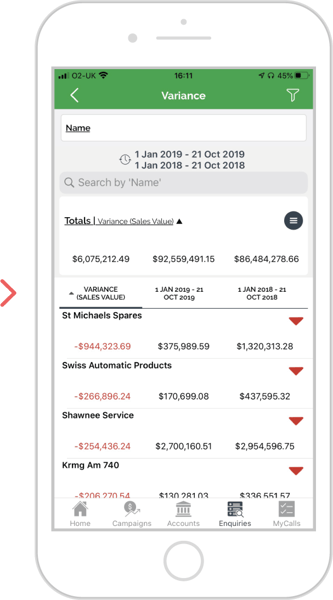
Step 5: Results
sales-i will default to show your biggest shrinking customer first.
You can now see your customers spend for the current YTD vs the PYTD and the variance between those two figures. These are your customers that are spending less year on year.
Note: You can tap on any of the table headers to sort them in alphabetical, ascending or descending order. The default date range selected includes the current month and the last full day, meaning you can now compare dates up to the end of the last day in both date ranges.
Android
Step 1: Click Enquiries
From the navigation bar at the bottom of your screen, tap ‘Enquiries’.
Step 2: Click drop down
Here you can choose whether to dive into an already saved enquiry or to start a new enquiry. Tap the red ‘New Enquiry’ button on the top left of your screen.
Step 3: Search
Tapping this button will then give you 3 enquiries to choose from. Tap on Variance.
Step 4: Choose bubble
Here you will see your data analysis bubbles.
These bubbles are broken down into 5 analysis fields. Customer, Sales Team, Calendar, Sales and Product.
Scroll down your screen to see more bubbles. In the Customer Analysis Field, tap the ‘Name’ bubble.
Step 5: Results
sales-i will default to show your biggest shrinking customer first.
You can now see your customers spend for the current YTD vs the PYTD and the variance between those two figures. These are your customers that are spending less year on year.
Note: You can tap on any of the table headers to sort them in alphabetical, ascending or descending order. The default date range selected includes the current month and the last full day, meaning you can now compare dates up to the end of the last day in both date ranges.