
Calendar bubbles allow you to display your Enquiries results by calendar information, such as weeks or months.
Scroll down to read about all the calendar bubbles, or select a specific bubble from the list below to jump to that bubble's explanation:
Day | Day Type | Days in Period | Day of Week | Day of Week in Period | Day of Period | Day of Quarter | Day of Half | Day of Year | Holiday | Week of Period | Week of Quarter | Week of Half | Week of Year | Period of Year | Week | Month | Period | Quarter | Half | Year
Top Tip!
Check out the Top Tips under the explanations for some advice and examples of when to use these bubbles!
Calendar Bubbles
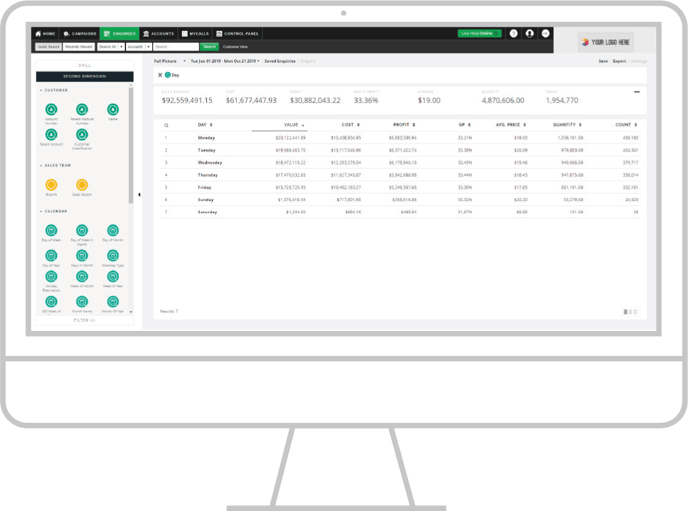
Day
Allows you to break down sales by what was sold on Mondays, Tuesdays, Wednesdays, etc. The sales for the selected date range will be accumulated into the days of the week and not split into daily sales (want to see daily sales? Use the Day of Year bubble)
Top Tip!
This bubble is great for looking at how sales vary from one day to the next and seeing which day of the week tends to have the highest sales.
Day Type
Day type compares Weekday sales to Weekend sales, allowing you to compare the two for the date range you have selected.
Days in Period
Allows you to identify how many days there are in the date range you have selected, for example, 31, 30, 29 or 28.
Day of Week
Day of Week displays sales across the 1st day, 2nd day, 3rd day, etc. of your week.
Day 1 will represent whatever day you have set as the first day of the week (for example, Sunday vs. Monday).
Top Tip!
Add this bubble as a Second Dimension with the Day bubble to clearly identify which day you have set as the first day of the week as well as seeing which day of the week tends to have the highest sales.
Day of Week in Period
See the explanation for the Week of Period bubble.
Day of Period
Denotes the date of the month, for example, 1 would be the 1st of the month.
Top Tip!
Use this bubble with the pre-set date range of ‘Monthly’ to identify daily sales for the current month so far.
Doing this in Full Picture provides you access to multiple measurements (for example, Quantity, Value, Profit) when viewing daily sales for the current month.
Variance will display a comparison of daily sales in the current month vs the same month last year.
Day of Quarter
Denotes the day of the quarter, where 1st of January is 1 and 31st March is 90. This figure resets to 1 at the beginning of each new quarter.
Top Tip!
Check your date range! If your selected date range falls across two quarters, for example Q1 and Q2, the numbers displayed will show an accumulation of sales for day 1 of Q1 and day 1 of Q2. Avoid confusion by adding the Quarter bubble as a second dimension and (on desktop) sorting the results by this column.
Day of Half
Similar to the Day of Quarter bubble, this displays the day of the half of the year, where 1st January is 1 and 30th June is 182. This figure resets to 1 at the beginning of each new half.
Top Tip!
Check your date range! If your selected date range falls across two or more year halves, for example, H1 and H2, the numbers displayed will show an accumulation of sales for day 1 of H1 and day 1 of H2. Avoid confusion by adding the Half bubble as a second dimension and (on desktop) sorting the results by this column.
Day of Year
This shows sales for each day of the year from 1 to 365.
Top Tip!
Please note: this bubble shows the day of the year relating to a Gregorian calendar, where 1st January is day 1 and 31st December is day 365
Holiday
See how sales compare on national holidays.
Check out, for example, how your Memorial Day sales compare this year to last year.
Top Tip!
Do you host an annual event? Want to compare sales for this event for each year? Do you sell internationally and want to identify national holidays for specific countries? Contact us to request a calendar day be added as a ‘holiday’ for your sales-i database.
Week of Period
This displays sales for each week of the selected period or month, where 1st – 7th January would be week 1, and so on…
Check out how sales compare in the first week of this month to the first week of the same month last year by using this bubble in a Variance Enquiry!
Top Tip!
Check your date range! If your selected date range falls across two or more periods/months, for example, January and February, the numbers displayed will show an accumulation of sales for week 1 of January and week 1 of February. Avoid confusion by adding the Month or Period of Year bubble as a second dimension and (on desktop) sorting the results by this column.
Week of Quarter
This displays sales for each week of a quarter. This figure resets to 1 at the beginning of each new quarter.
Top Tip!
Check your date range! If your selected date range falls across two quarters, for example, Q1 and Q2, the numbers displayed will show an accumulation of sales for week 1 of Q1 and week 1 of Q2. Avoid confusion by adding the Quarter bubble as a second dimension and (on desktop) sorting the results by this column.
Week of Half
Similar to the Week of Quarter bubble, this displays the week of the half of the year. This figure resets to 1 at the beginning of each new half.
Top Tip!
Check your date range! If your selected date range falls across two or more year halves, for example, H1 and H2, the numbers displayed will show an accumulation of sales for week 1 of H1 and week 1 of H2. Avoid confusion by adding the Half bubble as a second dimension and (on desktop) sorting the results by this column.
Week of Year
This shows sales for each week of the year from 1 to 52.
Top Tip!
This bubble is great for comparing year over year sales by week in a Variance report.
Please note: this bubble shows the day of the year relating to a Gregorian calendar, where 1st January - 7th January is week 1 and so on through to week 52
Period of Year
This shows sales for each month of the year from 1 to 12.
Top Tip!
This bubble is great for comparing year over year sales by month in a Variance report.
Note: this bubble shows the day of the year relating to a Gregorian calendar, where January is month 1 and December is month 12
Week
Similar to Week of Year, this shows sales for each day of the year from 1 to 365 but the numbers are prefaced with the letter W, making it easier to understand the figures displayed, especially when exporting these results from sales-i.
Top Tip!
This bubble is great for comparing year over year sales by week in a Variance report.
Note: this bubble shows the week of the year relating to a Gregorian calendar, where 1st January - 7th January is week 1 and so on through to week 52
Month
You can see sales in January, February, March, April, etc.
Top Tip!
On desktop, add a second dimension of Period of Year to have the ability to sort your results from month 1-12 (rather than in alphabetical order)
Period
See the explanation for the Period of Year bubble.
Back to Top
Quarter
Breaks down annual sales into 4 quarters, with the quarters aligning with the calendar year.
For example, Q1 will always represent sales for January, February, and March.
Back to Top
Half
Breaks down annual sales into 2 halves, with the halves aligning with the calendar year.
For example, H1 will always represent sales for January to June.
Back to Top
Year
Displays sales for the selected date range by calendar year.
Top Tip!
Check your date range! If your selected date range shows an incomplete year (for example, the ‘3 Months’ pre-set date range), remember that the results are not displaying annual sales, merely total sales for the date range selected, segmented by year.
Use the ‘Since’ date range to quickly identify a wider date range, including more years of data.