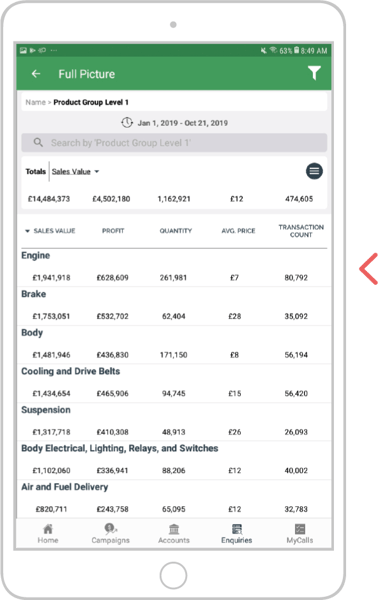
A new feature that has been added to sales-i Enquiries is ‘Dynamic Sub-totaling’. You can now gather totals of the data you choose.
For this example, we will show you how to find the total for your top 5 biggest spending accounts and then the product group they purchase from.
Select a device:
Desktop
Step 1: Enquiries
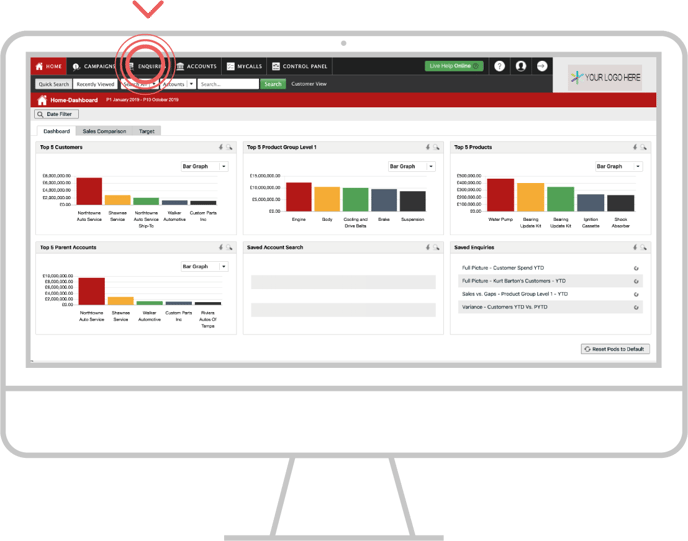
From the top black navigation select the Enquiries tab.
Step 2: Gather data
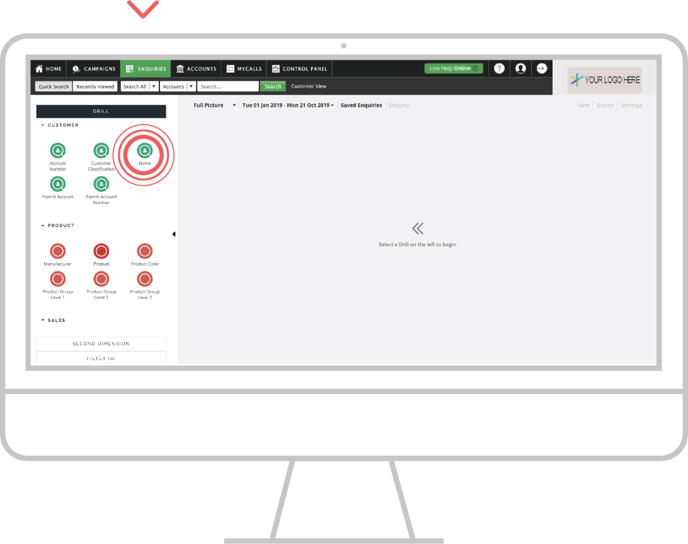
We are using the Full Picture Enquiry and selecting the Name bubble from the left-hand side using the YTD default date range for this example.
Step 3: Select rows
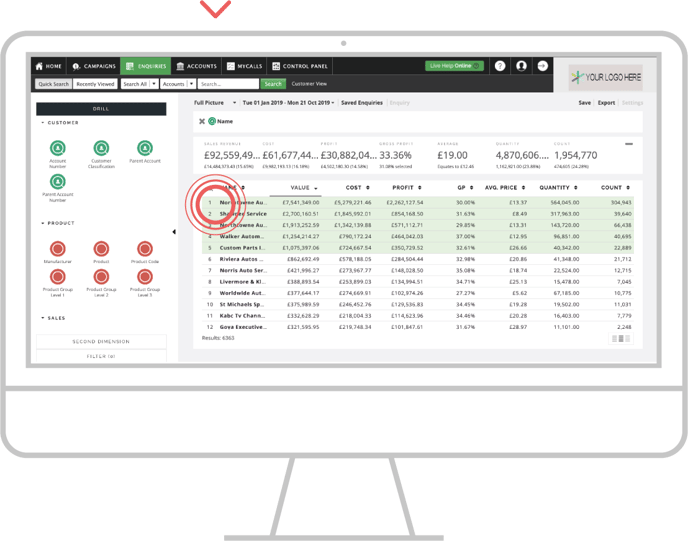
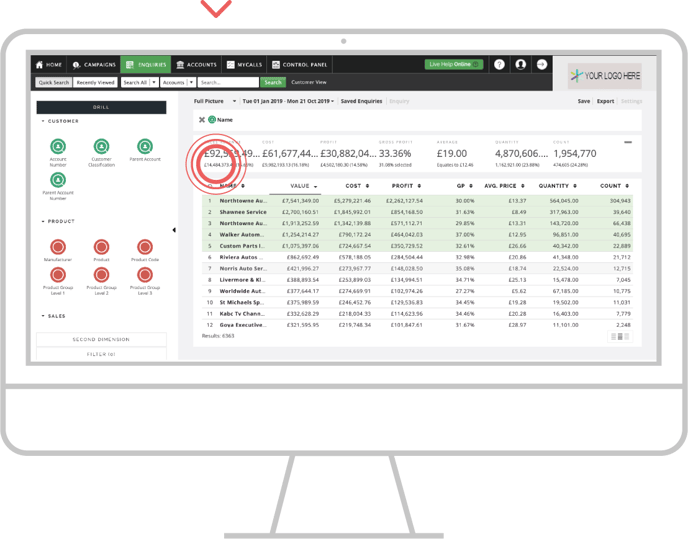
Click on each of the top 5 customers in the list, alternatively select the top option and whilst hold shift on your keyboard, click the last account you wish to select. This works best for larger accounts.
Step 4: View totals
As you are select the rows of data you will see the Sub Total appear below the main Totals at the top of the page.
Step 5: Drill further
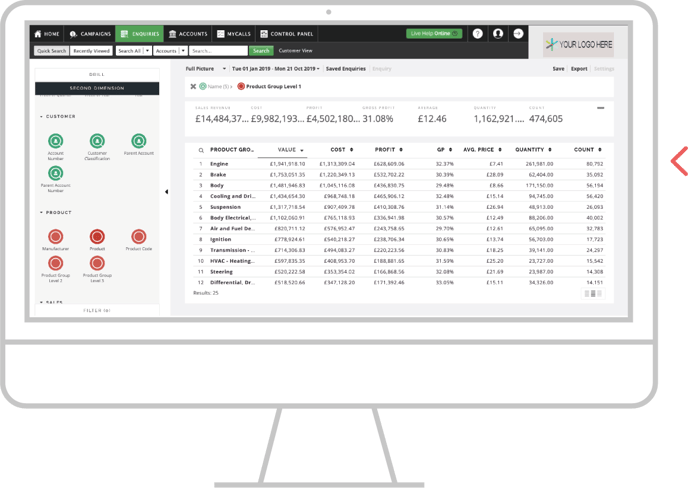
Now you have the customers selected, choose the Product Group Level 1 bubble from the left hand side to drill into and see data against the customers selected.
Apple
Step 1: Enquiries
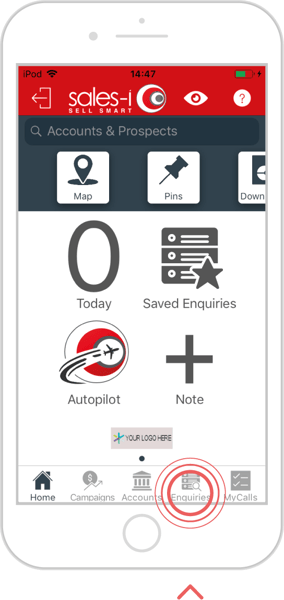
From the main navigation at the bottom of the page, select the Enquiries tab.
Step 2: Gather data
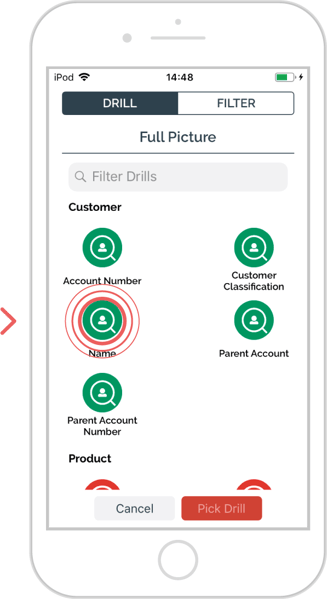
Starting a New Enquiry, we are using the Full Picture Enquiry and selecting the Name bubble using the YTD default date range for this example.
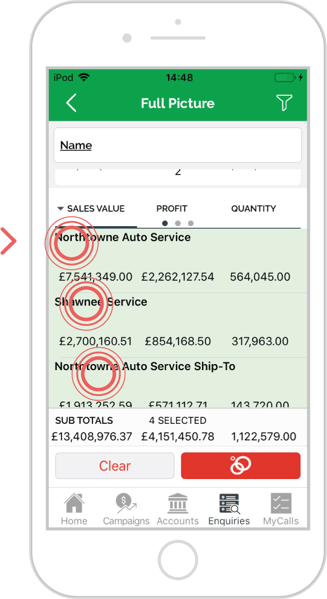
Step 3: Select rows
Tap on each of the top 5 customers in the list or any of your choosing.
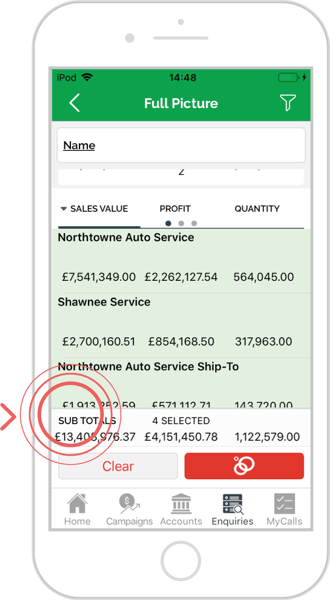
Step 4: View totals
As you select the rows of data you will see the Sub Total appear at the bottom of the page.
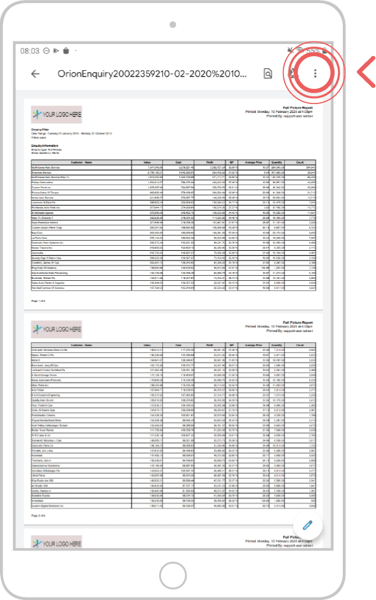
Step 5: Drill further
Now you have the customers selected, choose the Drill option at the bottom of the page and select Product Group Level 1 bubble to drill into and see data against the customers selected.
Android
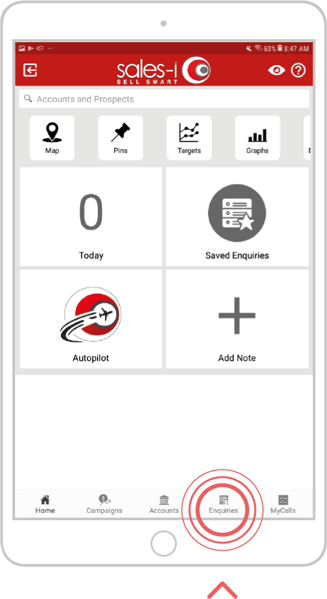
Step 1: Enquiries
From the main navigation at the bottom of the page, select the Enquiries tab.
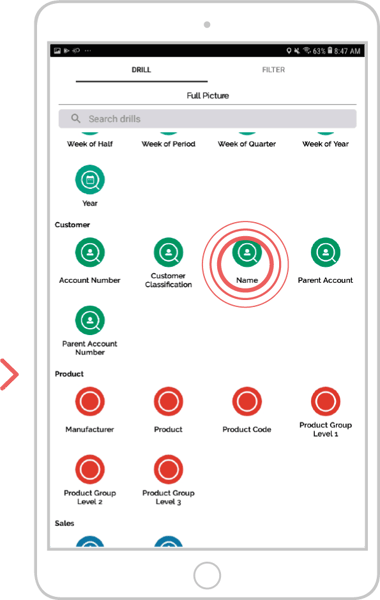
Step 2: Gather data
Starting a New Enquiry, we are using the Full Picture Enquiry and selecting the Name bubble using the YTD default date range for this example.
Step 3: Select rows
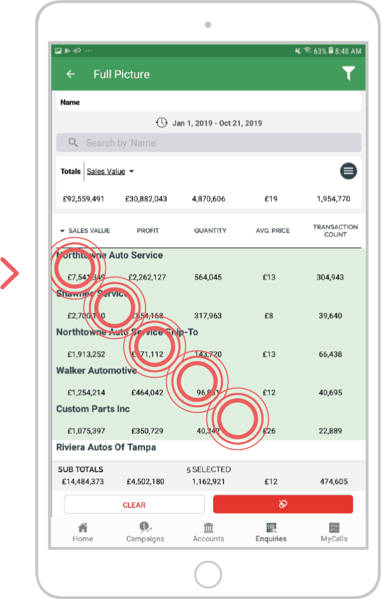
Tap on each of the top 5 customers in the list or any of your choosing.
Step 4: View totals
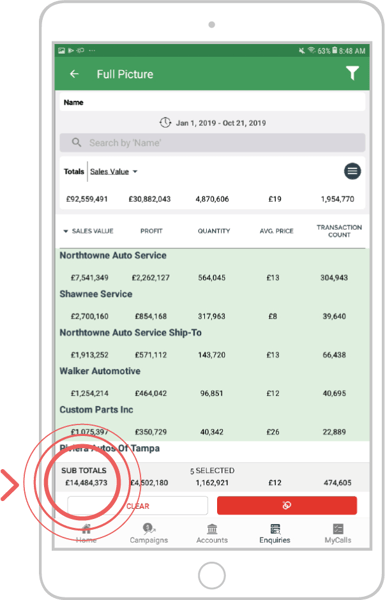
As you select the rows of data you will see the Sub Total appear at the bottom of the page.
Step 5: Drill further
Now you have the customers selected, choose the Drill option at the bottom of the page and select Product Group Level 1 bubble to drill into and see data against the customers selected.
